PageSpeed Insights: How to Read and Act on Your Score
AI Summary
What is PageSpeed Insights? PageSpeed Insights is Google’s free page performance tool. It is the most important speed tool for SEO because it shows your real-user Core Web Vitals from the Chrome User Experience Report alongside lab diagnostics that tell you what to fix.
What it is and who it is for: Built for site owners and developers who have run PageSpeed Insights, gotten a number, and were not sure what they were looking at. This page explains the difference between the field and lab sections, what the score means, and how to turn the report into a prioritized fix list.
The rule: The performance score at the top is lab data and does not affect rankings. The Core Web Vitals assessment below it is field data and does. Read the report from the field data down, not from the score up.
What PageSpeed Insights Is
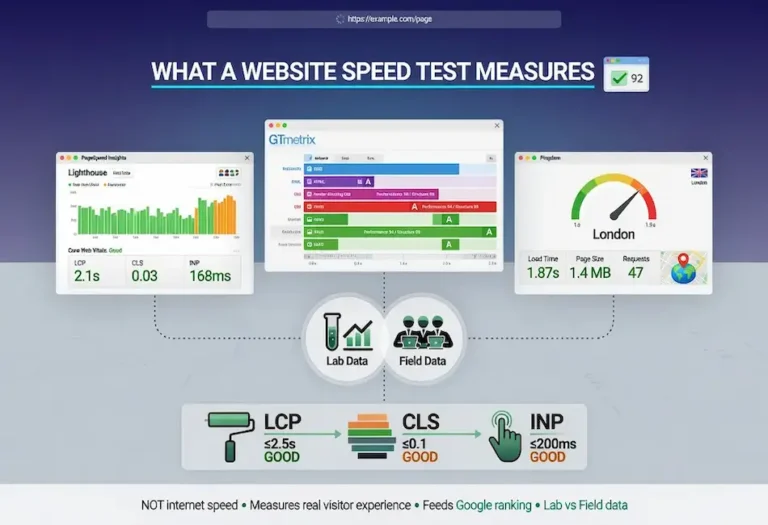
PageSpeed Insights is Google’s free tool for measuring page performance, available to anyone at pagespeed.web.dev. You enter a URL, it analyzes the page, and it returns a performance score along with detailed data about loading, interactivity, and visual stability. We reach for it first on every performance engagement, and not just because it is free.
The reason it matters more than any other speed tool is the data source. PageSpeed Insights is the only mainstream tool that shows you the actual Core Web Vitals data Google holds for your page, pulled from the Chrome User Experience Report. That is the same real-user data Google uses when it factors page experience into rankings. Other tools simulate performance. PageSpeed Insights shows you what Google actually sees.
It runs on Lighthouse, Google’s open-source auditing engine, for its lab analysis, and layers the CrUX field data on top. The combination is what makes it powerful: field data tells you whether you have a real problem, and lab data tells you what is causing it. Learning to read the two sections correctly is the difference between fixing the right thing and chasing a number that does not matter.
The Field Data Section
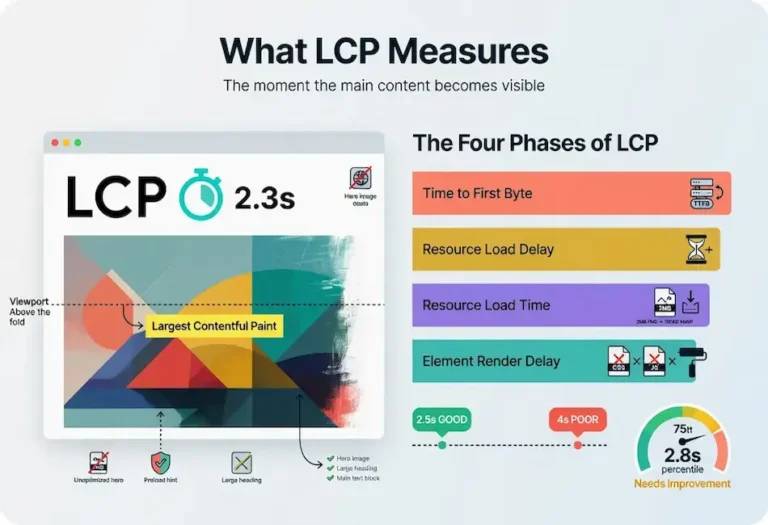
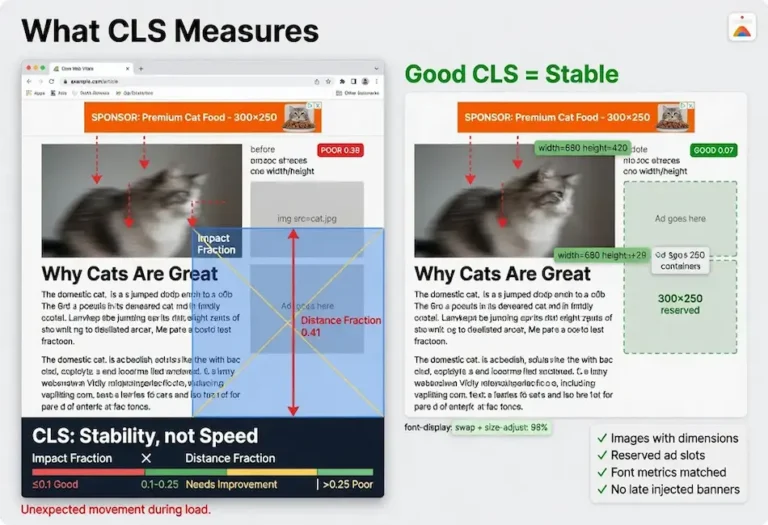
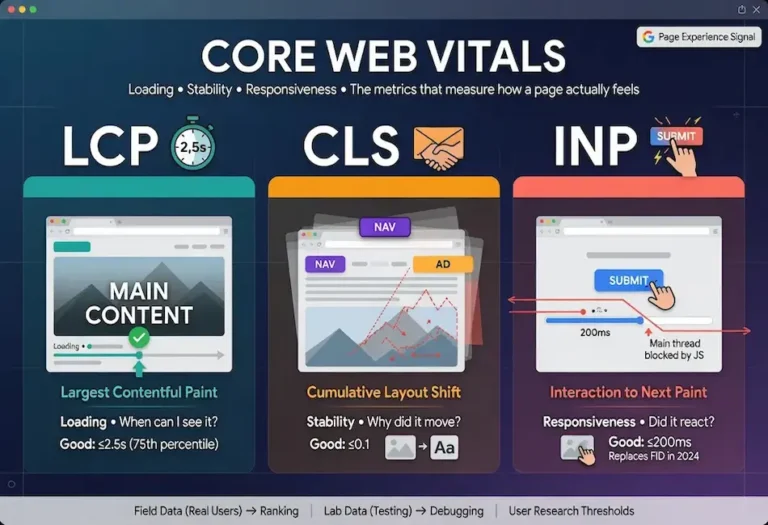
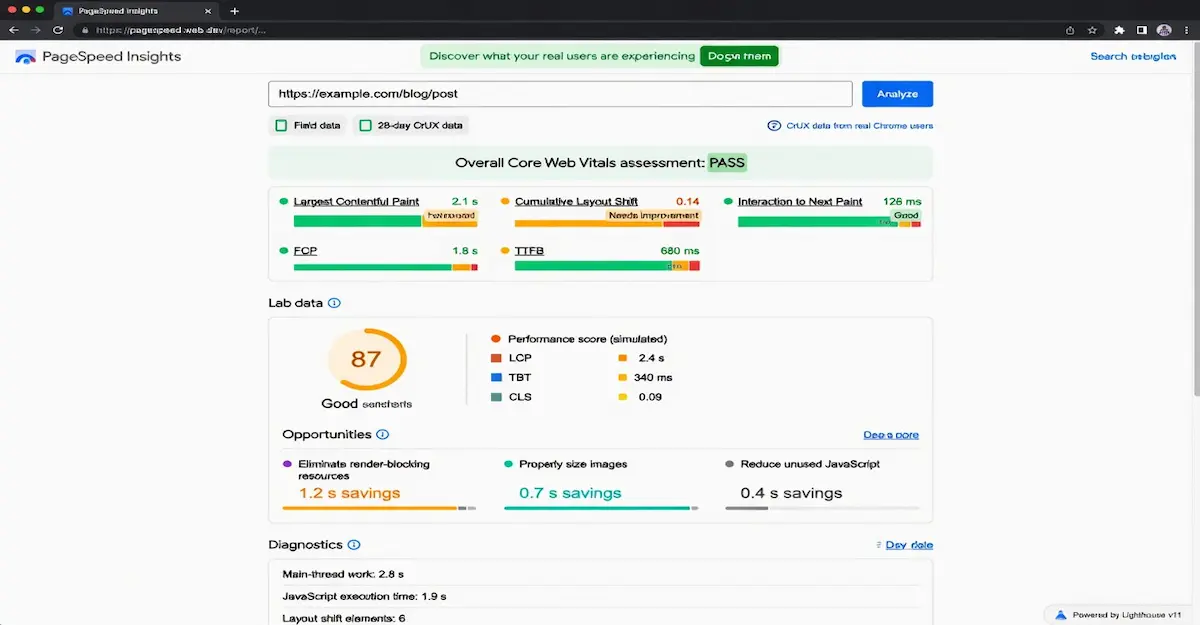
At the top of the report, when Google has enough traffic data for your page, you see a section labeled “Discover what your real users are experiencing.” This is the field data, and it is the part that affects your rankings. It shows your three Core Web Vitals, Largest Contentful Paint, Cumulative Layout Shift, and Interaction to Next Paint, plus First Contentful Paint and Time to First Byte, each measured at the 75th percentile of real Chrome users over the trailing 28 days.
Each metric gets a colored bar: green for good, amber for needs improvement, red for poor. Above the individual metrics is the overall Core Web Vitals assessment, which simply passes or fails. To pass, all three Core Web Vitals must be in the green at the 75th percentile. One red vital fails the whole assessment.
If you do not see this section, it means Google does not have enough CrUX data for your page, which is common for low-traffic pages and new sites. In that case PageSpeed Insights falls back to origin-level data for your whole domain, or shows only lab data. A new site with no field data is not being penalized, it simply has not accumulated enough real-user samples yet. As traffic grows, the field data appears.
The Lab Data Section and the Score
Below the field data, or at the top if no field data exists, is the lab analysis: the big performance score from 0 to 100, color-coded, with the metrics that feed it. This is where most people start, and starting here is the mistake. The lab score is a simulated test run from Google’s infrastructure under throttled conditions. It is useful, but it is not what Google ranks on, and it can diverge significantly from your real users’ experience.
The score is a weighted blend of lab metrics, with LCP and the renamed Total Blocking Time, which approximates INP in the lab, carrying the most weight. Because it is a single test under fixed conditions, the score can swing between runs, sometimes by ten points or more, depending on network conditions and what third-party scripts happened to load. Do not treat a single lab score as gospel. Run it a few times and watch the range.
The right mental model: the lab score is a diagnostic instrument, not a grade. A 100 in the lab with failing field vitals means your real users are having a worse time than the test suggests. A mediocre lab score with passing field vitals means you are fine where it counts. The field data is the truth. The lab data is the toolkit for understanding it.
Reading Opportunities and Diagnostics
Below the metrics, the report lists Opportunities and Diagnostics. This is the most actionable part of the entire tool and the part most people scroll past. Opportunities are specific suggestions with estimated time savings: eliminate render-blocking resources, properly size images, defer offscreen images, reduce unused JavaScript, serve images in next-gen formats. Each one shows roughly how much load time you could recover by addressing it.
The estimated savings are what let you prioritize. If “eliminate render-blocking resources” shows a potential 1.2 second saving and “properly size images” shows 0.3 seconds, you know where to start. Work the list in order of impact, not in order of how easy each fix sounds. The biggest time savings usually come from render-blocking resources and oversized images, which map directly to the Largest Contentful Paint phases.
The Diagnostics section below Opportunities gives additional detail: main-thread work breakdown, JavaScript execution time, the number of requests, DOM size, third-party script impact. These do not always come with time estimates, but they point at structural issues. Heavy main-thread work and long JavaScript execution are usually behind poor INP, while large layout-affecting elements show up when Cumulative Layout Shift is the problem.
How to Actually Use the Report
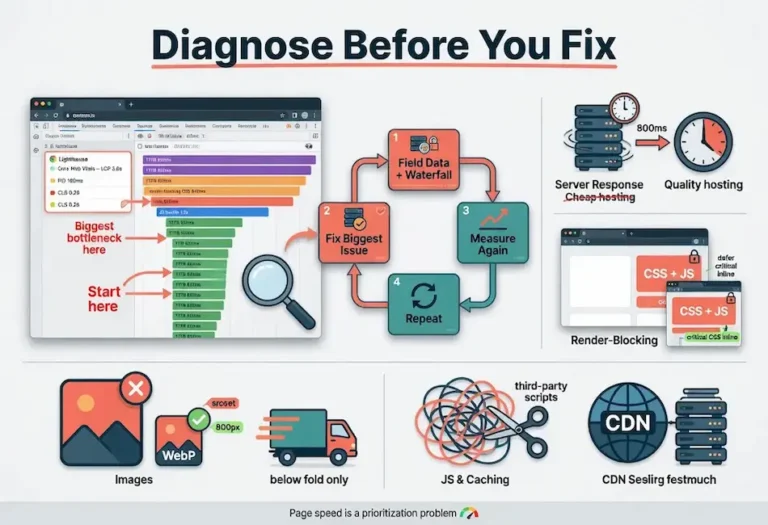
Here is the workflow we use. Start with the field data Core Web Vitals assessment. If it passes, your page experience is fine for ranking purposes and you can focus your energy elsewhere. If it fails, note which specific vital is red, because that tells you which category of problem you are solving: loading, stability, or responsiveness.
Then drop to the Opportunities and Diagnostics to find the cause. Match the failing field vital to the relevant lab findings. A failing LCP sends you to render-blocking resources and image sizing. A failing CLS sends you to layout-affecting elements and unsized media. A failing INP sends you to JavaScript execution and main-thread work. Fix the highest-impact items first, deploy, and verify.
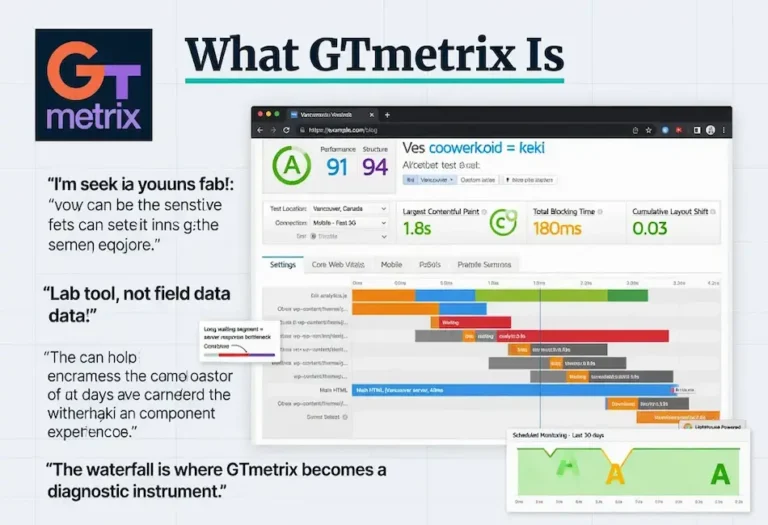
The verification step has a catch worth knowing. Lab data updates the instant you re-test, so you can confirm a fix worked in the lab immediately. But field data lags, because it averages real users over a trailing 28-day window. After a fix, the lab score moves now, but the field data, the data that affects rankings, can take up to four weeks to fully reflect the improvement. Do not panic when the field vitals have not moved the day after you deploy. For repeatable lab testing while you wait, compare against another tool, like the one covered in GTmetrix does this as well, and review the full lineup in the speed testing tools section of our main guide.
FAQ
Is the PageSpeed Insights score a ranking factor?
No. The 0 to 100 performance score is lab data from a simulated test and does not directly affect rankings. The Core Web Vitals assessment in the field data section, based on real Chrome user data, is what feeds Google’s page experience ranking signals. Read the report from the field data, not the lab score.
Why does my PageSpeed Insights score change every time I run it?
The lab score comes from a single simulated test under throttled conditions, and factors like network variability and which third-party scripts load can shift the result between runs, sometimes by ten points or more. Run it several times to see the range rather than treating any single score as definitive.
Why is there no field data for my page?
Field data only appears when Google has enough real Chrome user traffic for your page in the Chrome User Experience Report. Low-traffic pages and new sites often lack this data, so the tool falls back to origin-level or lab-only data. This is not a penalty, just insufficient sample size, and it resolves as traffic grows.
What should I fix first in a PageSpeed Insights report?
Start with the failing Core Web Vital in the field data to identify the problem category, then work the Opportunities list in order of estimated time savings. The largest savings usually come from eliminating render-blocking resources and properly sizing images. Fix the highest-impact items first rather than the easiest-sounding ones.
How long after a fix does PageSpeed Insights update?
Lab data updates immediately when you re-test. Field data lags because it averages real users over a trailing 28-day window, so improvements to your Core Web Vitals can take up to four weeks to fully appear in the field section. The lab score confirms your fix worked; the field data confirms it reached real users.
Is PageSpeed Insights better than other speed tools?
For SEO purposes, yes, because it is the only mainstream tool that shows the real-user Core Web Vitals data Google actually uses for ranking. Tools like GTmetrix and Pingdom offer excellent lab diagnostics and features PageSpeed Insights lacks, but only PageSpeed Insights surfaces the field data that determines your page experience signals.