GTmetrix: How to Run and Interpret a Performance Report
AI Summary
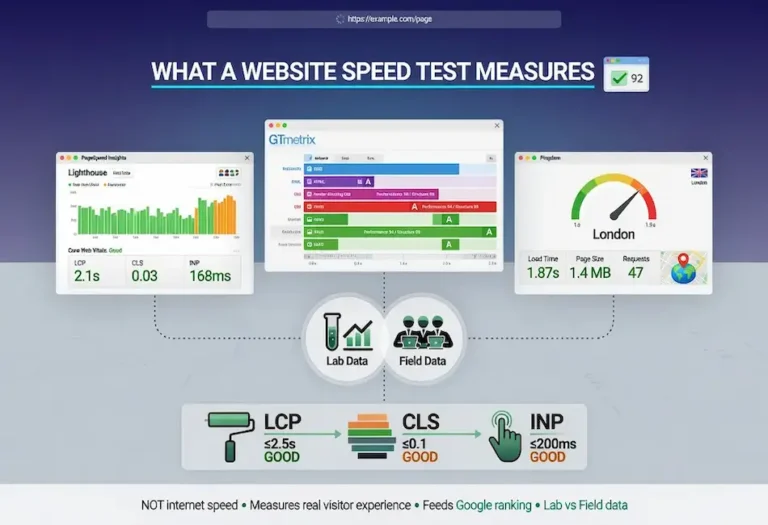
What is GTmetrix? GTmetrix is a page performance tool that combines Google Lighthouse data with its own structured grading system and a detailed request waterfall. It is built for repeatable lab testing and ongoing performance monitoring, which makes it the tool of choice for verifying fixes and catching regressions.
What it is and who it is for: Built for site owners and developers who want a clear, repeatable performance grade and the request-level detail to act on it. This page explains how to run a GTmetrix test, read the grade, use the waterfall, and where GTmetrix fits alongside PageSpeed Insights.
The rule: GTmetrix is a lab tool. It is excellent for diagnosing and verifying, repeatable in a way real-user data is not, but it does not show the field data Google ranks on. Use it to fix and confirm, then check your standing in PageSpeed Insights.
What GTmetrix Is
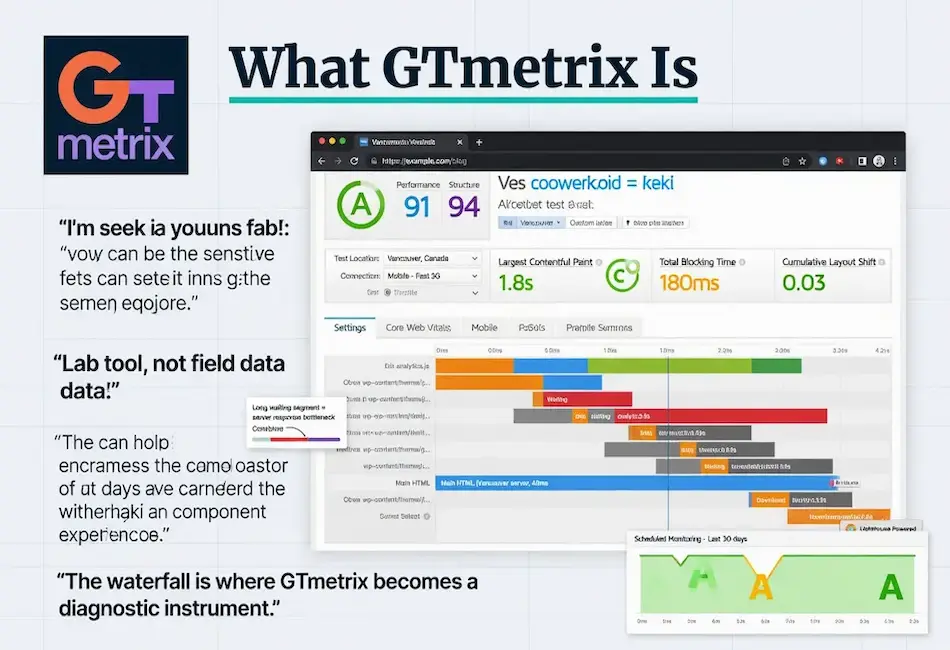
GTmetrix is a web performance testing tool available at gtmetrix.com. You give it a URL, it loads the page in a real browser from a chosen location, and it returns a graded report covering load time, page structure, and the full sequence of requests the page made. We use it as our repeatable lab instrument, the tool we return to when we need to verify that an optimization actually worked.
Under the hood, modern GTmetrix runs on Google Lighthouse, the same engine behind PageSpeed Insights. What GTmetrix adds is its own presentation layer: a clean letter grade, a structured breakdown of performance and structure scores, and a request waterfall that is easier to read than most. The Lighthouse data is the same, but the way GTmetrix organizes it makes findings simpler to communicate, especially to a client who is not technical.
The distinction that matters: GTmetrix is a lab tool. Every test runs in a controlled environment from a specific test location on a defined connection. That control is exactly what makes it valuable for debugging, because the conditions are repeatable, but it also means GTmetrix does not show the real-user field data that Google uses for ranking. It tells you how the page performs under test conditions, not how your actual visitors experience it.
Running a Test the Right Way
The default test gives you a result, but the settings are where GTmetrix earns its keep, and using the defaults blindly produces misleading numbers. The single most important setting is the test location. GTmetrix lets you choose where the test runs from, and the result changes dramatically depending on whether that location is near your actual audience. Testing a US business from a server in London will show worse numbers than your real users experience, and testing from right next to your server will show better.
The second setting that matters is the connection throttling. GTmetrix can test on an unthrottled connection or simulate various real-world speeds. An unthrottled test on a fast connection makes everything look good and hides the problems your mobile users hit. Throttling to a realistic mobile connection surfaces the issues that actually affect a meaningful slice of your traffic. Test under conditions that resemble your real audience, not conditions that flatter your page.
The third is the device and browser. Test on the configuration your analytics says your audience actually uses. If most of your traffic is mobile, a desktop test is measuring an experience most of your visitors never have. The free tier limits some of these options, but even within those limits, choosing the right location is the difference between a useful test and a vanity number.
Reading the GTmetrix Grade
GTmetrix presents results as a letter grade from A to F, backed by two component scores. The Performance score is Lighthouse-derived and reflects the same metrics PageSpeed Insights measures, weighted toward loading and interactivity. The Structure score is GTmetrix’s own assessment of how well the page is built for performance, independent of the specific load conditions of the test.
The split between Performance and Structure is genuinely useful and underused. Performance can fluctuate with test conditions, the same way a PageSpeed lab score does. Structure is more stable because it evaluates the page’s construction rather than a single load. A page with a strong Structure score but a weak Performance score usually has good bones and a specific bottleneck, often server response or a heavy third-party script. A page weak on both has fundamental construction problems. Reading the two together tells you whether you are fixing a config issue or rebuilding.
The report surfaces the same Core Web Vitals approximations Lighthouse provides: Largest Contentful Paint, Total Blocking Time as the lab proxy for interactivity, and Cumulative Layout Shift. These are the lab versions of the Core Web Vitals, useful for diagnosis but, again, not the field data that affects ranking.
The Waterfall Chart
The waterfall is where GTmetrix becomes a diagnostic instrument rather than a scorecard, and it is the feature I open first on any real investigation. The waterfall chart shows every single request the page makes, in chronological order, with a timing bar for each one broken into phases: DNS lookup, connection, SSL negotiation, waiting for the server, and downloading.
This view makes specific problems visible in a way that aggregate scores cannot. A single request with a long waiting segment points at a slow server response for that resource. A long chain of requests that block each other reveals a dependency problem. A third-party script that takes two seconds to resolve shows up as a clear outlier. A redirect chain appears as a series of requests resolving before the real content even starts. When a page is slow and the score does not tell you why, the waterfall does.
Reading the waterfall is a skill worth developing. Look for the long bars, the gaps where nothing is happening, and the requests that everything else waits on. The largest contentful element will be somewhere in that waterfall, and seeing when it starts downloading relative to everything else often explains a slow loading metric immediately. The waterfall turns “the page feels slow” into “this specific request is the problem.”
Monitoring and Where GTmetrix Fits
The feature that distinguishes GTmetrix for ongoing work is scheduled monitoring. You can set tests to run automatically on a recurring basis and track performance over time, with alerts when the grade drops below a threshold you set. For SEO work, where page speed is not a one-time fix but a property you have to maintain, this is exactly the right capability. A site update, a new plugin, or a bloated image uploaded by a client can quietly degrade performance, and monitoring catches it before it sits there for weeks.
Here is how GTmetrix fits with the other tools in practice. PageSpeed Insights is where you check your real standing, because it shows the field data Google ranks on. GTmetrix is where you diagnose and verify, because its repeatable lab tests and waterfall let you isolate causes and confirm fixes without waiting for field data to update. A simpler option is Pingdom’s simpler test, strong for quick geographic load checks. You can see the full lineup in the speed testing tools section of our main guide.
My honest take after years of using all of them: GTmetrix is the one I keep open during active optimization work because the waterfall and the repeatability make it the best debugging surface. PageSpeed Insights is the one I check to know whether the work moved the number that matters. Using GTmetrix alone, without verifying against field data, risks optimizing for a test rather than for users.
FAQ
Is GTmetrix better than PageSpeed Insights?
They serve different purposes. GTmetrix offers superior lab diagnostics, a clearer waterfall, and scheduled monitoring, making it better for debugging and verifying fixes. PageSpeed Insights shows real-user field data that Google uses for ranking, which GTmetrix does not. Use GTmetrix to diagnose and confirm, then check PageSpeed Insights for your actual ranking standing.
What test location should I use in GTmetrix?
Choose the location closest to your actual audience. The test result changes significantly based on the distance between the test server and the page’s server, so testing from a location near your real visitors produces the most representative result. Testing from a distant location shows worse numbers than your users experience, and testing next to your server shows better.
What is the difference between the Performance and Structure scores?
Performance is Lighthouse-derived and reflects how the page loaded under the specific test conditions, so it can fluctuate between runs. Structure is GTmetrix’s assessment of how well the page is built for performance regardless of load conditions, so it is more stable. A strong Structure score with weak Performance usually means good construction with a specific bottleneck.
What does the GTmetrix waterfall chart show?
The waterfall shows every request the page makes in chronological order, with each request’s timing broken into phases: DNS lookup, connection, SSL, waiting for the server, and downloading. It makes specific bottlenecks visible, such as a slow server response, a blocking third-party script, or a redirect chain, that aggregate scores cannot reveal.
Does GTmetrix use the same data as Google?
GTmetrix runs on Google Lighthouse, the same engine behind PageSpeed Insights, so its lab metrics align with Google’s lab measurements. However, GTmetrix does not access the Chrome User Experience Report field data that Google uses for ranking. Its numbers are lab data from a controlled test, not real-user data.
Can GTmetrix monitor my site automatically?
Yes. GTmetrix offers scheduled monitoring that runs tests automatically on a recurring basis and tracks performance over time, with alerts when your grade drops below a set threshold. This is valuable for SEO because it catches performance regressions from site updates, new plugins, or oversized images before they degrade rankings.