How to Improve Page Speed: A Practical Optimization Guide
AI Summary
What is this guide? A practical, prioritized walkthrough of how to actually improve page speed, organized by impact: server response time, render-blocking resources, image optimization, JavaScript reduction, font loading, caching, and CDN. Each fix is mapped to the Core Web Vital it improves so you know what moves when you make the change.
What it is and who it is for: Built for site owners, developers, and SEO practitioners who have run a speed test, seen a bad score, and need to know what to fix first. This guide does not list every possible optimization. It sequences the ones that produce the most improvement in the least time, in the order that prevents you from wasting effort on the wrong thing. Includes WordPress-specific and Shopify-specific guidance because the fixes differ by platform.
The rule: Diagnose before you fix. Find where the time is going, then fix that specific thing. Applying twenty optimizations at once without measuring between them means you never learn what worked, and you cannot undo the change that broke something. Work in order of impact, measure after each change, and stop when you pass.
Diagnose Before You Fix
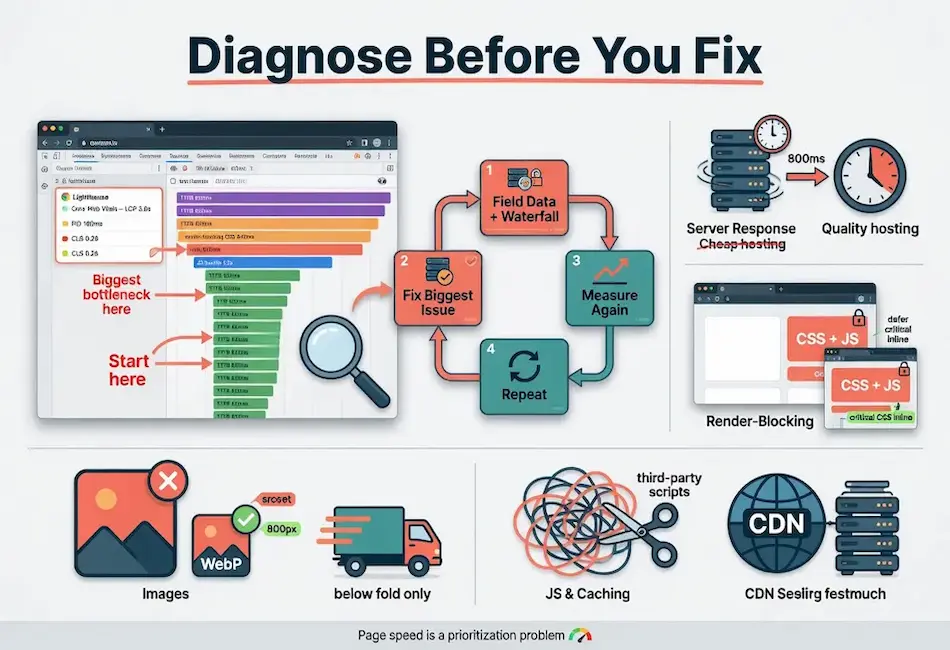
The most common mistake in page speed work is starting with fixes instead of diagnosis. Someone reads a list of optimizations, applies all of them, and sees little improvement because the thing actually slowing their page was not on the list, or was item nine when they stopped at item three. Page speed is a prioritization problem. Before you change anything, find out where the time is going.
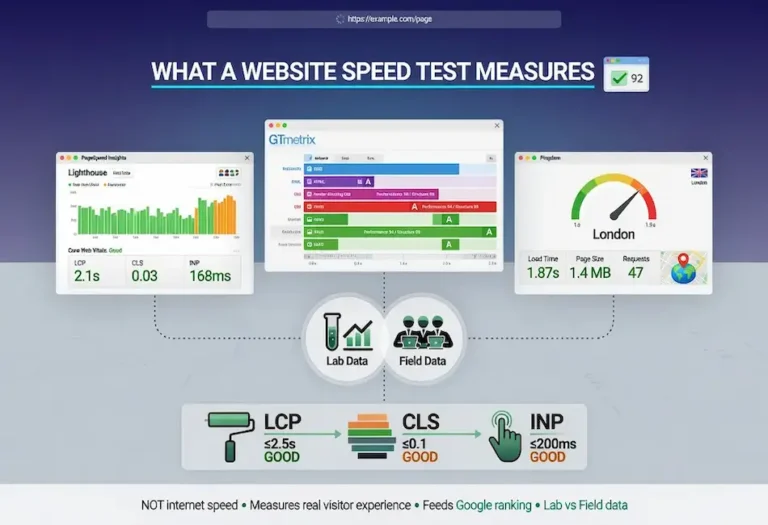
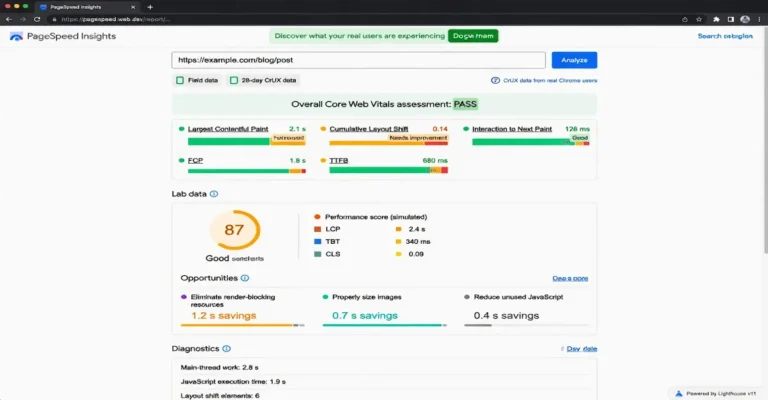
Run the page through PageSpeed Insights to see your real-user field data and which Core Web Vitals are failing. Then run it through Pingdom to read the request waterfall and see which specific requests are eating the time. The failing vital tells you the category of problem. The waterfall tells you the specific cause. Together they tell you where to start.
Work in order of impact and measure after each change. Fix the biggest bottleneck, re-test, confirm it moved, then attack the next one. This disciplined loop beats applying twenty optimizations at once, because when you change everything simultaneously you never learn what actually worked, and you cannot tell which change to undo when something breaks. The calibration discipline applies directly here: measure, adjust, measure again.
Server Response Time
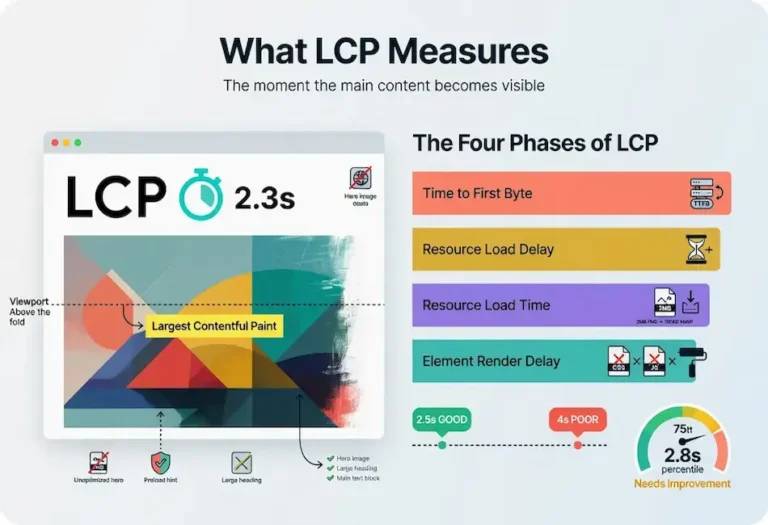
Server response time, measured as Time to First Byte (TTFB), is the foundation everything else sits on. If your server takes 800 milliseconds to send the first byte, every other optimization is working against a delay that already happened before the browser received anything. A slow server caps your best possible result no matter how perfectly you optimize the front end.
The target for good TTFB is under 200 milliseconds. Between 200 and 600 milliseconds is acceptable but improvable. Above 600 milliseconds is a clear bottleneck that needs to be addressed before any other optimization work produces its full value. TTFB directly feeds Largest Contentful Paint because every millisecond the server spends processing is a millisecond the browser cannot spend loading and rendering content.
The most common cause of slow TTFB is cheap shared hosting, and it is the fix people most resist because it costs money. Sites paying a few dollars a month for hosting are sharing a server with hundreds of other sites, competing for CPU, RAM, and disk I/O. Under load, response times spike. Upgrading to quality hosting or a managed platform cuts TTFB in half across every page at once, making it frequently the highest-leverage spend in page speed work.
Server-Side Caching
Without caching, every page request triggers the full backend processing pipeline: PHP execution, database queries, template assembly, and response construction. On WordPress, this can mean 50 to 200 database queries per page load. Server-side caching stores the fully assembled HTML and serves it directly to subsequent visitors, bypassing the entire backend. This reduces TTFB from seconds to milliseconds and is the single most impactful speed optimization for any CMS-based site.
Database Optimization
Even with page caching, the initial cache-building request and any dynamic pages that bypass the cache still hit the database. Unoptimized databases accumulate overhead from post revisions, transient options, orphaned metadata, and unindexed tables. Regular database maintenance (removing post revisions beyond the most recent few, cleaning up transients, optimizing table indexes) keeps the queries that do run executing quickly.
Render-Blocking Resources
Render-blocking resources are the most common cause of slow LCP after server response. When the browser encounters CSS or synchronous JavaScript in the document head, it must download, parse, and process those files before it can paint anything. The user stares at a blank or partially rendered screen while the browser works through resources that may not even be needed for the initial view.
CSS
CSS blocks rendering by design, because the browser needs styles to paint correctly. The fix is to identify the critical CSS needed for above-the-fold content, inline that small subset directly in the head so it is available immediately, and defer the rest of the stylesheet to load after the initial paint. Critical CSS is typically 10 to 30 KB, enough to style the header, hero area, and first visible content block. The remaining CSS loads asynchronously and applies after the page is already visible.
The implementation varies by platform. WordPress plugins like Autoptimize and WP Rocket can extract and inline critical CSS automatically. For custom sites, tools like Critical (by Addy Osmani) generate the critical CSS from a page URL. The result is the same: the browser has enough CSS to paint immediately and loads the rest without blocking.
JavaScript
JavaScript is the bigger offender and the easier win. Scripts that are not marked async or defer block the HTML parser while they download and execute. Most scripts do not need to block rendering. Adding the defer attribute lets the browser continue parsing and run the script after the document is parsed. Adding async lets the script run independently when ready, but execution order is not guaranteed, which matters for scripts with dependencies.
Deferring non-critical JavaScript is one of the highest-impact, lowest-effort page speed fixes available. It improves both LCP (the browser can paint sooner) and INP (less main-thread contention during the initial load). The rule is simple: if the script is not needed to render the above-the-fold content, defer it.
Image Optimization
Images are usually the heaviest asset type on a page, and unoptimized images are the single most common cause of slow load times. The fixes are well established and high impact, and most sites have significant room to improve.
Format
Modern formats compress dramatically better than legacy formats at equivalent visual quality. WebP produces files 25% to 35% smaller than JPEG. AVIF pushes further, typically 30% to 50% smaller. Converting images to WebP is frequently the fastest large win available because it reduces file size across every image on the site with no visible quality loss. PNG should only be used for images requiring transparency, and even then WebP supports transparency at smaller sizes.
Sizing
Serve images at the dimensions they will actually display, not larger. A hero image that renders at 800 pixels wide should be served at 800 pixels wide, not at the 4000-pixel camera original scaled down in the browser. The wasted pixels transfer bandwidth without any visual benefit. Use the srcset attribute to provide multiple sizes and let the browser choose the one that matches the viewport width and device pixel ratio.
Compression
Most images can lose quality imperceptibly while shedding substantial file size. JPEG quality of 75 to 85 is visually indistinguishable from 100 on most content images, at a fraction of the file size. Tools like Squoosh, ShortPixel, and Imagify handle compression without requiring manual quality judgment on every image. The goal is the smallest file that looks indistinguishable from the original at the display size.
Lazy Loading
Lazy loading defers image downloads until the image enters or approaches the viewport, keeping below-the-fold images from competing for bandwidth during the initial load. The native HTML loading=”lazy” attribute handles this without JavaScript. The critical exception: never lazy-load the LCP image or any above-the-fold image. Lazy loading the LCP element delays the most important asset on the page and directly harms your LCP score. Lazy-load what is below the fold. Prioritize what is above it.
Dimensions in HTML
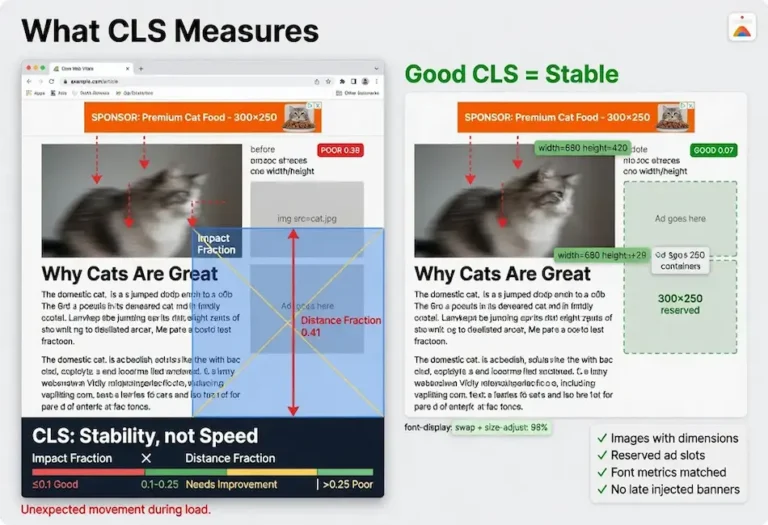
Always include width and height attributes on image elements. This allows the browser to reserve the correct space before the image downloads, preventing layout shift when the image arrives. Missing dimensions are the most common cause of CLS failures and one of the simplest fixes in all of page speed optimization.
JavaScript and Main-Thread Work
JavaScript is the primary driver of poor Interaction to Next Paint (INP) and a major contributor to slow loading. Beyond the render-blocking issue already covered, the sheer volume of JavaScript a page ships and executes determines how responsive it feels. When the main thread is busy parsing and running scripts, it cannot respond to user input, and interactions stall.
Reduce Total JavaScript
Audit what the page loads and remove what is not needed. Sites accumulate scripts over years, from abandoned features, redundant plugins, and tag manager entries nobody remembers adding. Removing unused JavaScript shrinks both the download and the execution burden. Chrome DevTools Coverage panel shows exactly which JavaScript and CSS files have unused code, with percentage breakdowns that reveal the waste.
Minify and Bundle
Minification strips whitespace, comments, and shortens variable names, reducing file size by 20% to 40% without changing functionality. Bundling combines multiple small files into fewer larger ones, reducing the number of HTTP requests. Most build tools and WordPress plugins handle both automatically. The caution with bundling is that a single enormous bundle can be worse than several smaller ones if the browser has to download and parse the entire bundle before any of it executes.
Third-Party Scripts
Third-party scripts deserve special scrutiny because they are both heavy and outside your direct control. Analytics, chat widgets, ad networks, marketing automation, social embeds, and A/B testing tools each add weight and main-thread work. They frequently account for the majority of a page’s JavaScript execution time. Audit them honestly. Remove the ones that do not earn their cost. Defer the ones you keep. Load them after the page is interactive wherever possible. The waterfall in your speed test makes the cost of each third-party script visible and undeniable.
Code Splitting
For JavaScript-heavy applications, code splitting divides the bundle into chunks that load on demand rather than all at once. The initial page load only downloads the JavaScript needed for the current view, and additional code loads as the user navigates. This reduces the initial JavaScript payload and improves both loading speed and INP because the main thread processes less code during the critical first seconds.
Font Loading
Web fonts affect both LCP and CLS. When the LCP element is text, the font loading strategy directly determines how fast the text renders. When the custom font swaps in with different metrics than the fallback, text reflows and shifts, contributing to CLS. Optimizing font loading addresses both metrics simultaneously.
font-display: swap
The font-display: swap declaration tells the browser to show text immediately in the fallback font while the custom font downloads, then swap when ready. This ensures the LCP text element renders without waiting for the font file, which is the right tradeoff for performance. The swap produces a visible font change, but that brief visual adjustment is better than invisible text or a delayed LCP.
Fallback Font Matching
The CLS cost of font swapping comes from metric differences between the fallback and custom fonts. The CSS @font-face size-adjust, ascent-override, descent-override, and line-gap-override descriptors let you tune the fallback to match the custom font’s proportions. When the metrics align, the swap causes no reflow and no layout shift. Perfect matching is difficult, but getting close eliminates most of the visible shift.
Preloading Fonts
Preloading the primary font file with <link rel=”preload” as=”font” type=”font/woff2″ crossorigin> gets the font to the browser earlier, reducing the window between fallback and custom rendering. The crossorigin attribute is required regardless of whether the font is on the same domain. Omitting it causes the browser to ignore the preload entirely. Only preload the font files actually used on the page. Preloading multiple weights and styles that are not needed wastes bandwidth.
Self-Hosting vs Google Fonts
Google Fonts requires a DNS lookup and connection to fonts.googleapis.com before the font file downloads. Self-hosting the font files on your own domain eliminates that extra connection and serves the font from the same CDN as the rest of your assets. For performance, self-hosting is faster. The tradeoff is that you lose automatic format updates from Google, but for a stable site the format rarely changes once set.
Caching
Caching keeps your optimizations from being recomputed on every visit. It operates at several layers, and each layer serves a different purpose.
Page Caching
Page caching stores fully built HTML pages so the server sends a pre-made response instead of generating it from the database and template engine on every request. This directly improves TTFB, often reducing it from 1 to 2 seconds down to under 200 milliseconds. On WordPress, caching plugins (WP Super Cache, W3 Total Cache, LiteSpeed Cache) or server-level caching (Nginx FastCGI cache, Varnish) handle this. The caution is that page caching can serve stale content or break dynamic features like shopping carts and logged-in views if not configured to exclude those pages.
Browser Caching
Browser caching tells returning visitors’ browsers to reuse files they already downloaded instead of fetching them again. This is controlled through Cache-Control and Expires headers on your static assets (CSS, JavaScript, images, fonts). Setting a long cache duration (one year is standard for versioned assets) means repeat visitors download those files once and never again until they change. The performance impact on first visits is zero, but repeat visits become dramatically faster.
Object Caching
Object caching stores database query results in memory so the server does not re-execute the same queries on every request. On WordPress, this uses an in-memory store like Redis or Memcached. Object caching matters most for dynamic pages that bypass page caching, like logged-in user dashboards, search results, and personalized content. It reduces database load and speeds up the backend processing that feeds into TTFB.
Content Delivery Networks
A CDN stores copies of your static assets on servers distributed around the world and serves each visitor from the location nearest them. This cuts the network distance between the visitor and the content, reducing the latency that adds to every resource download.
For a site serving a single local area, a CDN matters less because most visitors are geographically close to the origin server. For a site serving a region, a nation, or an international audience, a CDN can cut load times by 500 milliseconds or more for distant visitors. The improvement is most visible in TTFB for static resources and in total page load time when multiple assets download in parallel from the nearest edge.
Cloudflare’s free tier provides CDN, DNS, and SSL for any site. It caches static assets at edge locations worldwide and can be configured with page rules to cache full HTML pages for sites that do not require dynamic content on every load. For WordPress sites, Cloudflare combined with a server-side caching plugin covers both the origin-level and edge-level caching layers. The combination handles the majority of speed-related infrastructure without additional cost.
Speed Up WordPress
WordPress-specific speed optimization follows the same priority sequence as general page speed work, but the implementation uses WordPress tools and addresses WordPress patterns. The platform is fast when configured properly. The problems come from what gets stacked on top of it.
The Priority Sequence
First, install server-side page caching. This is the single highest-impact change. LiteSpeed Cache on OpenLiteSpeed hosting, WP Rocket on other hosting, or WP Super Cache as a free alternative. Caching alone often cuts load time in half.
Second, choose a lightweight theme. Kadence, GeneratePress, and developer-oriented themes produce clean HTML with minimal CSS and JavaScript. Page builder themes load hundreds of kilobytes of assets before content appears. The theme sets the performance floor for every page on the site.
Third, audit plugins. Every active plugin can add CSS and JavaScript to every page load. A site with 30 plugins is loading scripts from 15 of them on pages where those scripts serve no function. Remove plugins you do not actively use. For the ones you keep, check whether they offer options to conditionally load assets only on pages where they are needed.
Fourth, optimize images. Use WebP format. Compress before upload. Set correct dimensions. Ensure the hero image is not lazy loaded. WordPress handles some of this automatically since version 5.5 (lazy loading) and 5.8 (WebP support), but the LCP image needs manual attention to ensure it is excluded from lazy loading and prioritized with fetchpriority=”high”.
Fifth, add a CDN. Cloudflare free tier handles this for most WordPress sites with zero cost. Point your DNS to Cloudflare, enable the proxy, and static assets serve from the nearest edge.
Plugin Recommendations
Caching: LiteSpeed Cache (free, requires LiteSpeed/OpenLiteSpeed server) or WP Rocket (paid, works on any server). Image optimization: Imagify or ShortPixel (both handle compression and WebP conversion). Performance auditing: Query Monitor (free, shows database queries, hooks, and conditionals per page load).
Speed Up Shopify
Shopify handles server infrastructure, CDN, and SSL at the platform level, which removes the hosting variable. TTFB on Shopify is generally fast because the platform manages it. The speed problems on Shopify are almost entirely front-end: theme bloat, app scripts, and Liquid template rendering.
Theme Selection
The Dawn theme and similar lightweight themes built on Shopify’s Online Store 2.0 architecture outperform multipurpose themes by a wide margin. A theme designed for visual flexibility loads extra CSS, JavaScript, and font files to support features most stores never use. Switching from a heavy theme to Dawn or a comparably lean theme is often the single biggest speed improvement available on Shopify.
App Auditing
Each Shopify app installed has the potential to inject JavaScript into every page. A store with 15 or more apps frequently fails INP because the combined script weight overwhelms the main thread. The audit is straightforward: list every installed app, check whether each one is actively used and producing value, and remove the ones that are not. For apps you keep, check whether they offer options to load only on relevant pages rather than sitewide.
Image and Lazy Loading
Shopify’s CDN serves images automatically, but the source images still need to be properly sized. Uploading a 5000-pixel product image when the display size is 800 pixels wastes bandwidth even after Shopify’s automatic resizing, because the resizing is not always aggressive enough. Optimize source images before upload. Use Shopify’s native lazy loading for below-the-fold images and ensure the hero or first product image loads eagerly.
Mobile Page Speed
Mobile page speed is not just desktop speed on a smaller screen. Mobile visitors face slower processors, less RAM, higher-latency connections, and narrower bandwidth. A page that loads in 1.5 seconds on desktop can take 4 seconds on a mid-range phone over a 4G connection. Google evaluates mobile Core Web Vitals separately from desktop, and for most sites the mobile scores are worse.
The optimization priorities shift on mobile. JavaScript execution time matters more because mobile processors are slower, making INP failures more common. Image sizes matter more because bandwidth is constrained. Total page weight matters more because every kilobyte costs more time on a cellular connection than on broadband.
Responsive images with the srcset attribute are essential for mobile because they allow the browser to download a phone-sized image instead of a desktop-sized one. A hero image that is 1200 pixels wide on desktop should serve a 600-pixel variant on mobile, cutting the download in half. The sizes attribute tells the browser how wide the image will display at each viewport, enabling accurate source selection.
Test mobile speed separately. The Chrome DevTools device simulation lets you throttle the CPU and network to approximate real mobile conditions. PageSpeed Insights and Search Console both separate mobile and desktop scores. A page that passes all Core Web Vitals on desktop but fails on mobile has a mobile-specific problem that generic optimization will not solve. The fixes need to target what mobile visitors actually experience.
Measuring Your Progress
Page speed optimization is not a one-time project. It is a maintenance discipline. Speed degrades over time as content accumulates, plugins update, themes add features, and third-party scripts evolve. A site that passes all Core Web Vitals today can fail them six months from now without any deliberate change, simply from the weight of incremental additions nobody tracked.
Establish a measurement cadence. Monthly testing of your top pages catches degradation before it costs rankings or conversions. After any significant site change, including theme updates, new plugin installations, or additions of third-party scripts, re-test immediately. The cadence discipline applies directly: regular measurement prevents drift.
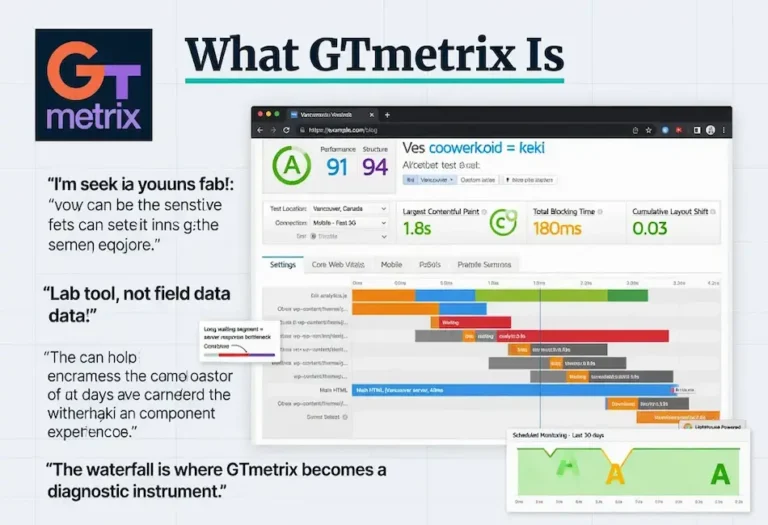
Use the right data source for each purpose. Field data from Search Console and PageSpeed Insights tells you where you actually stand in Google’s evaluation. Lab data from GTmetrix and Lighthouse tells you what to fix next. The Pingdom waterfall tells you which specific resource is the bottleneck. The website speed test guide maps the complete testing framework and when to use each tool.
Track your improvements against real-user field data, not lab scores. A fix that improves the lab score but does not move the field data after 28 days either did not affect real users or was offset by something else that degraded simultaneously. Field data is the ground truth. Lab data is the diagnostic tool. The distinction determines whether your optimization work is producing actual results or just better test scores.
Speed is one layer of the complete technical foundation that includes crawlability, internal linking architecture, and on-page optimization. Each reinforces the others. A fast site that Google can crawl efficiently, with well-linked content that satisfies E-E-A-T standards, is a site where every improvement compounds into the next one. If page speed is part of a larger engagement, our technical SEO services include performance optimization as one component of a complete technical audit.
FAQ
What is the fastest way to improve page speed?
Install server-side page caching. It reduces TTFB from seconds to milliseconds and is the single highest-impact change for most sites. After caching, optimize images by converting to WebP and serving at correct display dimensions. These two fixes produce the most visible improvement in the least time.
How do I speed up my WordPress website?
Install a caching plugin like LiteSpeed Cache or WP Rocket. Use a lightweight theme like Kadence or GeneratePress. Audit and remove unused plugins. Optimize images in WebP format at correct dimensions. Add Cloudflare for CDN and edge caching. This sequence covers the five highest-impact WordPress speed fixes in priority order.
How do I speed up my Shopify website?
Switch to a lightweight theme like Dawn if you are using a heavy multipurpose theme. Audit installed apps and remove any that are not actively producing value, because each app can inject JavaScript on every page. Optimize source images before upload. Ensure the hero or first product image loads eagerly and is not lazy loaded. Shopify handles server infrastructure and CDN automatically, so the fixes are entirely front-end.
What causes slow page speed?
The most common causes are slow server response time from cheap hosting, render-blocking CSS and JavaScript in the document head, large unoptimized images, excessive JavaScript from plugins and third-party scripts, missing caching, and no CDN for geographically distributed visitors. The specific cause on any given page is best identified by running a speed test and reading the waterfall to see which requests are consuming the most time.
Does page speed affect SEO rankings?
Yes. Page speed is measured through Core Web Vitals, which are part of Google’s page experience ranking signal. The signal functions as a tiebreaker: content relevance determines most of the ranking, but when pages are closely matched on content quality, the faster page can win the higher position. The indirect effects through user engagement and crawl efficiency often matter more than the direct signal.
How often should I test page speed?
Test your top pages monthly and after any significant site change such as a theme update, plugin installation, or addition of third-party scripts. Speed degrades over time as content and complexity accumulate. Monthly testing catches degradation before it impacts rankings or user experience. Use field data from Search Console for your actual standing and lab data from testing tools for diagnosis.
What is a good page speed score?
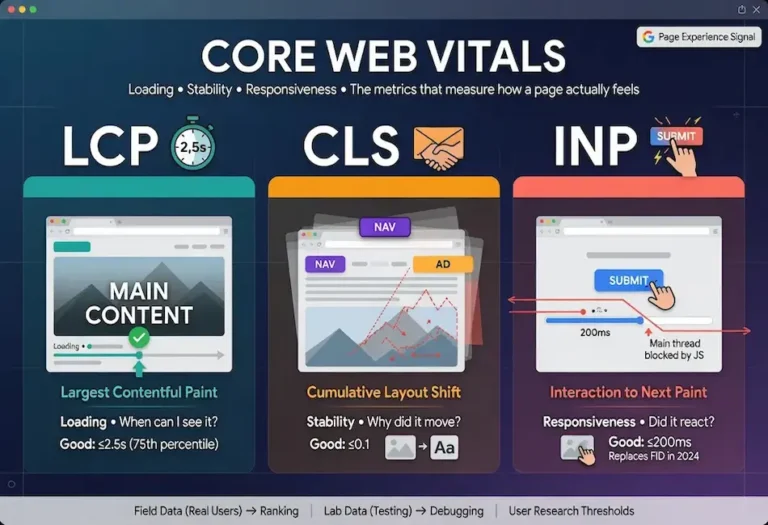
A good PageSpeed Insights performance score is 90 or above. For Core Web Vitals specifically: LCP under 2.5 seconds, CLS under 0.1, and INP under 200 milliseconds. These thresholds are measured at the 75th percentile of real user visits. Meeting all three puts your page in Google’s “good” category for page experience, which is the threshold that matters for the ranking signal.
Should I use a CDN for page speed?
If your audience is geographically distributed, yes. A CDN stores static assets at edge locations worldwide and serves each visitor from the nearest location, reducing network latency. For a site serving a single local area where most visitors are near the server, a CDN matters less. Cloudflare offers a free tier that includes CDN, DNS, and SSL, making it a zero-cost starting point for any site.