What Is GTmetrix? A Complete Guide to Website Performance Testing
AI Summary
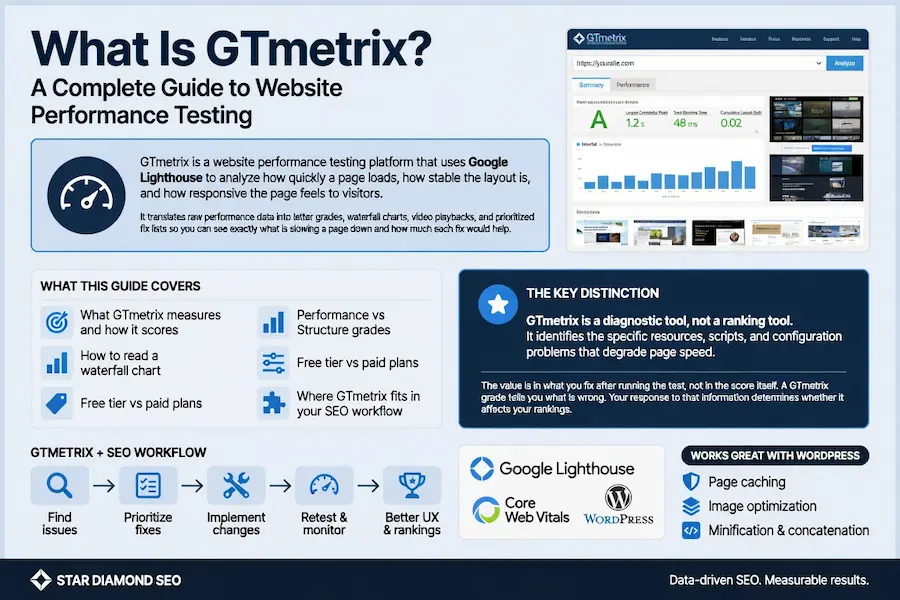
GTmetrix is a website performance testing platform that uses Google Lighthouse to analyze how quickly a page loads, how stable the layout is, and how responsive the page feels to visitors. It translates raw performance data into letter grades, waterfall charts, video playbacks, and prioritized fix lists so you can see exactly what is slowing a page down and how much each fix would help.
What this guide covers: What GTmetrix measures and how it scores, the difference between the Performance and Structure grades, how to read a waterfall chart, what the free tier includes versus the paid plans, where GTmetrix fits alongside other testing tools, and how WordPress site owners can get the most out of it.
The key distinction: GTmetrix is a diagnostic tool, not a ranking tool. It identifies the specific resources, scripts, and configuration problems that degrade page speed. The value is in what you fix after running the test, not in the score itself. A GTmetrix grade tells you what is wrong. Your response to that information determines whether it affects your rankings.
What Is GTmetrix?
GTmetrix is a web-based performance testing platform built by GT.net, a Canadian hosting and infrastructure company based in Vancouver. It analyzes any publicly accessible URL and produces a detailed report covering load speed, resource efficiency, and rendering behavior. The platform has become one of the most widely used speed testing tools on the web, particularly among WordPress developers and SEO professionals who need more diagnostic depth than a basic speed score provides.
Under the hood, GTmetrix runs Google Lighthouse to generate its performance data. Lighthouse is the same engine that powers PageSpeed Insights, which means the core metrics GTmetrix reports align with what Google itself measures. The difference is in presentation and additional tooling. GTmetrix layers its own grading system, waterfall visualization, video playback, and historical tracking on top of the raw Lighthouse data, making the output more actionable for people who need to diagnose and fix specific problems rather than just see a number.
GTmetrix operates 113 test servers across 25 global locations. Free accounts can test from 7 locations. Pro accounts unlock all 25. The default test location is Vancouver, which matters because geographic distance between the test server and your hosting server directly affects the results. Testing from Vancouver when your visitors are in London produces data that does not reflect your actual audience’s experience.
How GTmetrix Scoring Works
GTmetrix assigns two letter grades on every test: a Performance grade and a Structure grade. Both use an A through F scale. Understanding what each grade measures prevents the common mistake of optimizing for the wrong one.
The Performance grade comes directly from the Lighthouse Performance score. It reflects how fast the page loads and becomes usable, weighted across several metrics including Largest Contentful Paint, Total Blocking Time, and Cumulative Layout Shift. This grade is sensitive to server response time, image sizes, render-blocking resources, and JavaScript execution. A page with a large unoptimized hero image and multiple render-blocking scripts will score poorly here even if the HTML structure is clean.
The Structure grade evaluates how well the page follows performance best practices. It checks whether images use modern formats, whether CSS and JavaScript are minified, whether the browser cache is configured correctly, and whether resources are efficiently loaded. A page can have a good Structure grade but a poor Performance grade if the server itself is slow or the page is simply heavy. The reverse is also possible: a lightweight page on a fast server can score well on Performance while having structural issues that would cause problems at scale.
The composite GTmetrix Grade combines both scores. While the letter grade provides a quick summary, the individual metrics beneath it are where the diagnostic value lives. Two pages can both receive a B grade for entirely different reasons, and the fixes for each would be completely different.
GTmetrix and Core Web Vitals
Core Web Vitals are the three metrics Google uses as part of its page experience ranking signal. GTmetrix reports all three, but with an important distinction that changes how you should interpret the data.
GTmetrix measures Core Web Vitals using lab data. The test runs in a controlled environment from one of GTmetrix’s servers. This means the results reflect what would happen on a specific device type at a specific connection speed from a specific location. Google’s ranking signal, by contrast, uses field data collected from real Chrome users over a 28-day rolling window.
The practical impact: your GTmetrix Core Web Vitals numbers and your Chrome User Experience Report numbers can differ significantly. A page might show excellent LCP in GTmetrix because the test server is fast and close to your host, while real users on slower mobile connections experience much worse loading. GTmetrix also reports Total Blocking Time instead of Interaction to Next Paint. TBT measures how long the main thread is blocked during load, while INP measures responsiveness to actual user interactions throughout the page visit. They correlate but are not identical.
GTmetrix also integrates CrUX data when available, displaying the real-user field data alongside the lab results. This side-by-side view is one of GTmetrix’s most valuable features for SEO because it lets you see both the diagnostic data you can act on and the field data Google actually uses for ranking in the same report. The calibration between what the lab shows and what real users experience is where most speed optimization goes wrong, and GTmetrix surfaces both.
How to Read a GTmetrix Waterfall Chart
The waterfall chart is the most diagnostically valuable part of a GTmetrix report. It shows every resource the browser requests when loading the page, displayed in the order the requests happen, with colored bars indicating how long each resource takes to download and when it becomes available.
Each row in the waterfall represents one request: an HTML document, a CSS file, a JavaScript file, an image, a font, an API call, or any other resource the page needs. The horizontal axis is time. The width of each bar shows how long that request took. The color indicates the resource type. The position shows when the request started relative to the page load.
What makes the waterfall chart powerful is that it reveals the causal chain. A render-blocking CSS file that takes 800 milliseconds to download delays everything that depends on it. A third-party analytics script that loads synchronously blocks the main thread. A hero image served at 2,400 pixels wide when the container is 800 pixels wide wastes bandwidth on pixels nobody sees. These problems are invisible in a summary score but immediately obvious in the waterfall.
The waterfall also shows request chains, where one resource triggers the loading of additional resources. A CSS file that imports a Google Font triggers a second request to Google’s server, which triggers a third request for the actual font file. That chain adds latency that a flat resource list would not reveal. Identifying and breaking unnecessary request chains is one of the fastest ways to improve page speed.
For a complete walkthrough of GTmetrix’s features beyond the waterfall, including how to configure tests and interpret historical data, the GTmetrix step-by-step guide covers the full workflow.
Speed Visualization and Video Playback
GTmetrix records a video of every page load test, capturing what the visitor would actually see as the page renders. The Speed Visualization feature breaks this video into a filmstrip of screenshots at set intervals, showing the exact progression from blank screen to fully loaded page.
This feature solves a problem that metrics alone cannot: understanding the perceived experience. A page might have acceptable LCP numbers but display a jarring layout shift at the 3-second mark that frustrates visitors. The metrics would show a passing CLS score if the shift happened before the measurement window, but the video reveals the actual experience. Similarly, a page that loads its text content quickly but leaves image placeholders empty for 4 seconds looks broken to visitors even if the technical metrics pass.
Speed Visualization also helps communicate performance problems to non-technical stakeholders. Explaining that LCP is 3.8 seconds means nothing to a business owner. Showing them a filmstrip where their page is a blank white screen for nearly 4 seconds while a competitor’s page is fully loaded in 1.5 seconds communicates the problem instantly.
Free vs Pro: What Each Tier Includes
GTmetrix offers a free tier and multiple paid plans. The free tier is functional enough for occasional testing but limited enough that regular use requires an upgrade.
The free account includes on-demand testing from 7 global locations, basic Lighthouse reporting with Performance and Structure grades, waterfall charts, and video playback. It does not include scheduled monitoring, performance alerts, API access, or mobile device simulation. The default test location is Vancouver, and while you can choose from the 7 available locations, the remaining 18 are locked behind Pro.
Pro plans start with the Micro tier at $4.99 per month, which adds limited monitoring and more on-demand tests. The Solo tier at $13 per month provides 5 monitored URLs, 3 test locations for monitoring, and hourly monitoring intervals. The Starter tier at $25 per month expands to 15 monitored URLs, 5 test locations, API access, and priority support. The Growth tier at $50 per month covers 30 monitored URLs, 7 test locations, client reporting, and advanced alerting.
Business plans, including Champion, Team, and Enterprise tiers, add the highest test queue priority, white-label PDF reports, and team functionality for agencies and larger organizations. Custom plans are also available for specific needs.
For most site owners running a single site, the free tier is sufficient for periodic checks. The Solo or Starter tier makes sense once you need automated monitoring that alerts you when performance degrades, which matters for sites where speed directly affects revenue or rankings.
GTmetrix for WordPress
GTmetrix has become a standard tool in the WordPress community for a practical reason: WordPress sites tend to accumulate performance problems that GTmetrix is specifically good at identifying.
A typical WordPress site loads a theme with its own CSS and JavaScript, a page builder with additional scripts, multiple plugins that each inject their own assets, web fonts, and third-party tracking scripts. Each of these resources appears as a separate row in the waterfall chart. GTmetrix makes it straightforward to see which plugin is adding 400 milliseconds to the load time, which font is render-blocking, and which page builder script is executing for 1.2 seconds on the main thread.
The Structure audit is particularly useful for WordPress because it flags common WordPress-specific issues: unoptimized images served in outdated formats instead of WebP, missing browser cache headers on static assets, unminified CSS from themes that ship development builds, and JavaScript files loaded in the head that could be deferred. Each issue includes an estimated time savings, which helps prioritize fixes by impact rather than guessing.
GTmetrix also helps diagnose hosting problems that are common in WordPress. A TTFB above 600 milliseconds often indicates a slow hosting environment, inadequate PHP memory, or missing server-side caching. The waterfall chart shows the server response time as the first bar, making it immediately clear whether the delay is on the server side or the browser side. If the server is the bottleneck, no amount of image optimization or script deferral will fix the core problem.
GTmetrix vs Other Speed Testing Tools
GTmetrix is one of several speed testing tools, and each one serves a different diagnostic purpose. Understanding what GTmetrix does well and where it has gaps prevents you from relying on a single data source for decisions that affect your rankings.
PageSpeed Insights shows the field data Google uses for ranking alongside Lighthouse lab results. Its primary advantage is that it connects the diagnostic data directly to the ranking signal. GTmetrix provides more detailed waterfall analysis and historical tracking but uses lab data only for its own tests, supplementing with CrUX field data when available.
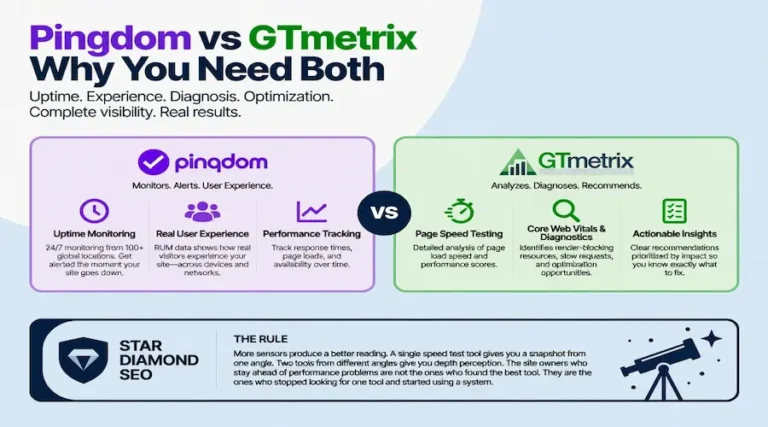
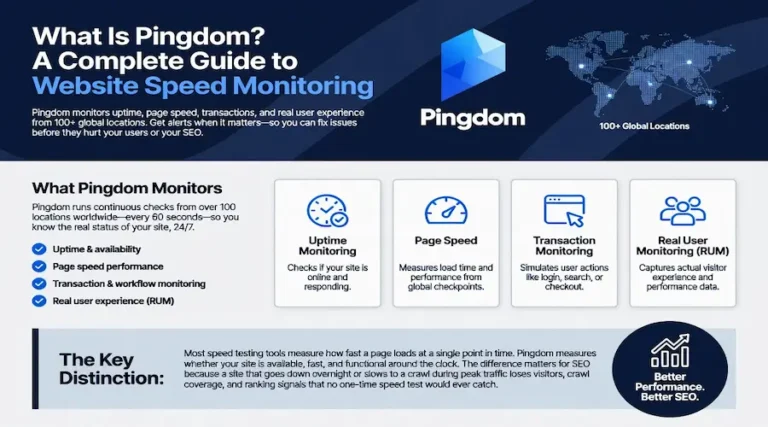
Pingdom tests from real browsers at real global locations and provides uptime monitoring, which GTmetrix does not offer. If your site goes down at 2 AM and comes back up by 6 AM, Pingdom would have caught it and alerted you. GTmetrix would not know it happened. Pingdom’s website speed test also measures from the visitor’s perspective using real browsers rather than simulated Lighthouse environments.
Lighthouse in Chrome DevTools provides the same core data as GTmetrix but runs locally from your own browser. This eliminates the network variable entirely, testing pure rendering performance without the geographic latency that affects remote tools. The trade-off is no historical tracking, no scheduled monitoring, and no global perspective.
The strongest approach uses all three. GTmetrix for deep diagnostics and historical tracking. PageSpeed Insights for field data validation. Pingdom or an equivalent for uptime monitoring and real-browser global testing. Each tool fills a gap the others leave open. The question of whether speed tests matter for SEO is less about which tool you use and more about whether you act on what the tools reveal.
Where GTmetrix Fits in an SEO Workflow
GTmetrix belongs in the technical SEO layer of your strategy. It is not a content tool, not an authority tool, and not a ranking tool. It is a diagnostic instrument that identifies mechanical problems in the technical foundation that supports your content and authority signals.
The workflow is straightforward. Run a GTmetrix test on your top-performing pages. Review the waterfall for obvious bottlenecks. Check the Structure audit for quick wins. Compare the lab data against the CrUX field data to see whether real users experience the same problems the test found. Fix the highest-impact issues first. Retest to confirm the fixes worked. Set up monitoring to catch regressions.
The cadence depends on the site. For a site that is actively being developed or redesigned, test after every significant change. For a stable site that changes infrequently, monthly testing catches the gradual performance degradation that happens as plugins update, ad scripts change, and content accumulates. The goal is not to maintain a perfect score. The goal is to stay above the thresholds where speed stops being a neutral factor and starts being a drag on rankings and user experience.
GTmetrix is one tool in a system. It works alongside your on-page SEO checklist, your crawlability audit, and your content strategy. None of these elements work in isolation. A fast page with weak content does not rank. Strong content on a slow page loses visitors before they read it. GTmetrix helps ensure the technical layer is not the weak link that drags everything else down. The broader context of how every layer connects is covered in the SEO knowledge base.
FAQ
What is GTmetrix used for?
GTmetrix is used to analyze website page speed and identify the specific resources, scripts, and configuration issues that slow a page down. It provides Lighthouse-based performance grades, waterfall charts that show every request in the load sequence, video playback of the rendering process, and a prioritized list of recommended fixes. It is primarily a diagnostic tool for web developers, SEO professionals, and site owners who need to understand why a page is slow and what to fix first.
Is GTmetrix free?
GTmetrix offers a free tier that includes on-demand testing from 7 global locations, Lighthouse performance and structure grades, waterfall charts, and video playback. The free tier does not include scheduled monitoring, performance alerts, API access, or mobile device simulation. Paid plans start at $4.99 per month for the Micro tier and range up to $50 per month for the Growth tier, with additional Business and Enterprise options for larger organizations.
What is a good GTmetrix score?
A good GTmetrix score is an A or B grade for both Performance and Structure. The Performance grade reflects how fast the page loads and becomes interactive. The Structure grade reflects how well the page follows speed optimization best practices. An A grade means the page performs well across all measured metrics. A B grade indicates minor issues that could be improved but are not critically impacting the user experience. Scores below C typically indicate problems worth fixing.
Does GTmetrix affect SEO rankings?
GTmetrix itself does not affect SEO rankings. It is a measurement tool, not a ranking factor. Google uses field data from real Chrome users to evaluate Core Web Vitals for ranking, not lab data from tools like GTmetrix. However, the problems GTmetrix identifies, such as slow server response, unoptimized images, and render-blocking scripts, do affect the user experience metrics that Google measures. Fixing those problems can improve the field data that Google uses for ranking.
What is the difference between GTmetrix Performance and Structure grades?
The Performance grade measures how fast the page actually loads. It comes from the Lighthouse Performance score and reflects metrics like Largest Contentful Paint, Total Blocking Time, and Cumulative Layout Shift. The Structure grade evaluates whether the page follows technical best practices such as image optimization, cache configuration, and resource minification. A page can score well on one and poorly on the other because they measure different things.
How many test locations does GTmetrix have?
GTmetrix operates 113 test servers across 25 global locations. Free accounts can test from 7 of those locations, with Vancouver as the default. Pro accounts unlock all 25 locations. Testing from a location close to where your actual visitors are produces more representative results than testing from the default Vancouver server.
Does GTmetrix work for WordPress sites?
Yes. GTmetrix is widely used in the WordPress community because its waterfall chart and structure audit are effective at identifying WordPress-specific performance problems such as plugin-related script bloat, unoptimized theme assets, slow hosting environments, and render-blocking resources injected by page builders. The detailed resource-by-resource breakdown makes it easier to isolate which plugin or theme component is causing the slowdown.
What is the difference between GTmetrix and PageSpeed Insights?
Both tools use Google Lighthouse for their core analysis, but they serve different purposes. PageSpeed Insights shows the Chrome User Experience Report field data that Google actually uses for ranking alongside Lighthouse lab data. GTmetrix provides more detailed waterfall analysis, video playback, historical performance tracking, and scheduled monitoring. PageSpeed Insights is better for checking the data Google uses for ranking. GTmetrix is better for diagnosing the specific cause of a performance problem and tracking whether fixes hold over time.