Pingdom vs GTmetrix: Why You Need Both
AI Summary
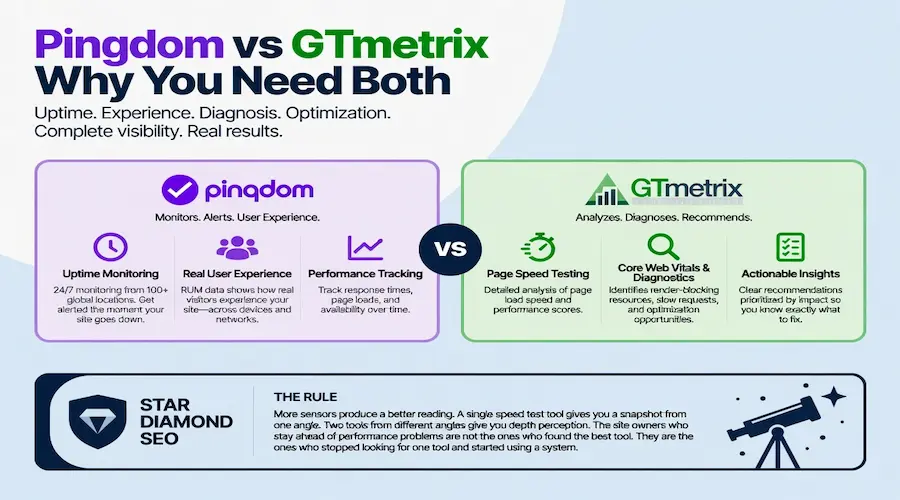
Pingdom vs GTmetrix is the wrong framing. These are not competing tools. They measure different things for different purposes, and using only one leaves gaps in your data that the other fills. Pingdom monitors whether your site is up, fast, and functional around the clock. GTmetrix diagnoses exactly why a page is slow and what to fix first. One watches. The other investigates. You need both.
What this guide covers: What each tool measures and how, where Pingdom excels and where it falls short, where GTmetrix excels and where it falls short, where they overlap, what you miss using only one, and how to combine them into a single workflow that catches problems other site owners never see.
The rule: More sensors produce a better reading. A single speed test tool gives you a snapshot from one angle. Two tools from different angles give you depth perception. The site owners who stay ahead of performance problems are not the ones who found the best tool. They are the ones who stopped looking for one tool and started using a system.
Why “Which One Is Better” Is the Wrong Question
Every comparison article about Pingdom and GTmetrix tries to declare a winner. That framing misses the point entirely. These tools were built to solve different problems. Asking which one is better is like asking whether a thermometer is better than a blood pressure cuff. They measure different vital signs. Neither one gives you the full picture alone.
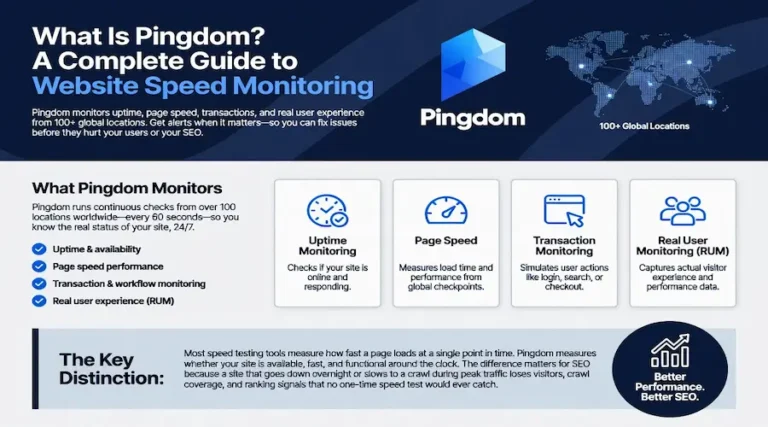
Pingdom is a monitoring platform. It watches your site continuously, checks whether it is up every 60 seconds from over 100 global locations, tracks real user experience, and alerts you the moment something goes wrong. It answers the question: is your site working right now?
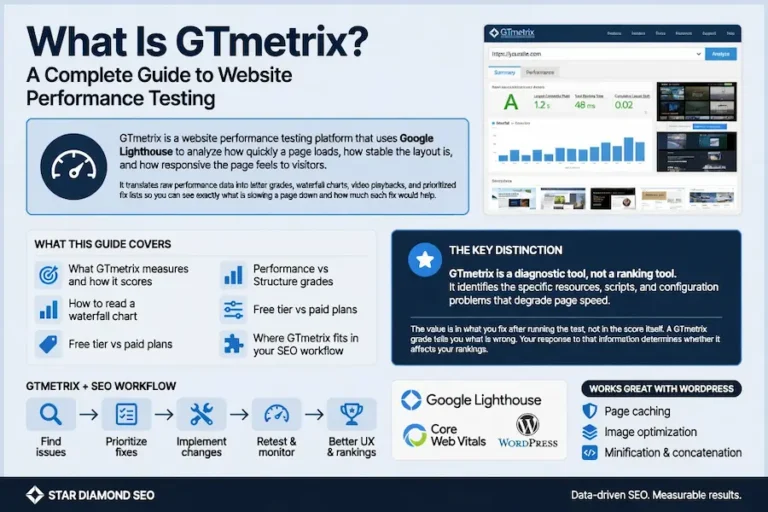
GTmetrix is a diagnostic platform. It runs Lighthouse-based performance analysis, produces detailed waterfall charts showing every resource request, and provides prioritized recommendations for what to fix. It answers the question: why is this specific page slow?
One watches the road. The other looks under the hood. Using only the monitoring tool means you know when something breaks but not why. Using only the diagnostic tool means you know what is wrong but not when it started or how often it happens. The value is in using both.
What Pingdom Measures and How
Pingdom operates across four monitoring capabilities. Uptime monitoring checks whether your site, API, DNS, or mail server is reachable from distributed global locations. Page speed monitoring loads pages in real browsers and tracks load time, page size, and request count over time. Synthetic transaction monitoring scripts multi-step user flows like checkouts and form submissions and alerts you when any step fails. Real user monitoring captures performance data from actual visitors on their own devices and connections.
The Pingdom speed test produces a waterfall chart, a performance grade, and summary metrics for any URL you test. But the speed test is only one piece of what Pingdom does. The real differentiator is that Pingdom never stops checking. It runs 24 hours a day, which means it catches the 3 AM outage, the slow server response during a traffic spike, and the broken checkout after a midnight plugin update. One-time testing tools miss all of these.
Pingdom does not run Lighthouse. It does not produce Core Web Vitals scores, Structure grades, or Lighthouse-based optimization recommendations. Its waterfall chart exists but is less granular than what dedicated diagnostic tools provide. Pingdom tells you that a page is slow. It does not always tell you exactly which resource is causing the problem or how much time each fix would save.
What GTmetrix Measures and How
GTmetrix runs Google Lighthouse under the hood, which means its core metrics align with what Google itself measures. It produces two letter grades: Performance (how fast the page loads and becomes interactive) and Structure (how well the page follows speed optimization best practices). Both use an A through F scale.
The platform reports Core Web Vitals including Largest Contentful Paint, Cumulative Layout Shift, and Total Blocking Time. It produces detailed waterfall charts that show every resource request in the load sequence with timing, size, and dependency information. Speed Visualization captures a filmstrip and video of the rendering process so you can see exactly what the visitor experiences at each point during the load.
GTmetrix operates 113 test servers across 25 global locations. Free accounts test from 7 locations. Pro accounts unlock all 25 plus scheduled monitoring, historical tracking, and API access.
What GTmetrix does not do is monitor uptime, track real user experience, or simulate multi-step transactions. It tests pages on demand or on a schedule. Between tests, it has no visibility into what is happening on your site. If your server goes down for two hours between scheduled tests, GTmetrix would not know it happened.
Where Pingdom Excels
Pingdom’s strength is continuous visibility. No other tool in this comparison watches your site around the clock from over 100 locations and alerts you the moment something breaks. That persistent monitoring creates a safety net that periodic testing cannot replicate.
Uptime monitoring catches outages that happen outside business hours, on weekends, or during periods when nobody is actively watching. For sites that generate revenue, every minute of undetected downtime is lost money and lost crawl opportunity. If Googlebot arrives during an outage and gets a 500 error, that crawl is wasted. If it happens repeatedly, crawl budget gets consumed by failed requests instead of indexing content.
Real user monitoring provides data from actual visitors that no lab test can replicate. A synthetic test runs from a server with a fast connection in a known location. RUM captures the experience of the person on a four-year-old phone with a 3G connection in rural India. That person’s experience is invisible to lab tools but very real in the engagement metrics that affect rankings.
Transaction monitoring solves a problem that both speed testing and uptime monitoring miss: a site can be up and fast while a critical workflow is broken. A checkout page that loads in 1.2 seconds but throws a JavaScript error when the user clicks the submit button is functionally down for every customer. Only transaction monitoring catches this.
Where GTmetrix Excels
GTmetrix’s strength is diagnostic precision. When you need to understand exactly why a page is slow and which specific fix will have the largest impact, GTmetrix provides more actionable detail than any monitoring tool.
The waterfall chart reveals the causal chain of every page load. A render-blocking CSS file that takes 800 milliseconds to download delays everything that depends on it. A third-party analytics script executing synchronously blocks the main thread for 1.2 seconds. A hero image served at 2,400 pixels wide when the container is 800 pixels wide wastes bandwidth on invisible pixels. These problems are obvious in the waterfall but invisible in a summary score or an uptime check.
The Structure audit flags specific optimization opportunities with estimated time savings for each fix. Instead of a generic “your site is slow,” GTmetrix says “deferring this render-blocking script would save 400 milliseconds” and “converting these images to WebP would reduce page weight by 1.3 MB.” That specificity turns a vague problem into a prioritized fix list.
GTmetrix also integrates CrUX data when available, showing the field data from real Chrome users alongside the lab results. This side-by-side view lets you see whether the problems found in lab testing match what real users actually experience. That calibration between lab and field is where most speed optimization goes wrong, and GTmetrix surfaces both in the same report. The step-by-step GTmetrix guide covers how to read and act on these reports.
Where They Overlap
Both tools test page speed and produce waterfall charts. Both can run from multiple global locations. Both offer scheduled monitoring on paid plans. This overlap is where the confusion comes from, and it is also where the differences become clearest.
Pingdom’s page speed test loads the page in a real browser and measures total load time, page size, and request count. GTmetrix loads the page through Lighthouse and measures LCP, TBT, CLS, and structural optimization metrics. They are both testing the same page, but they are measuring different things and reporting them differently. A page can score well in Pingdom’s performance grade while scoring poorly in GTmetrix’s Performance grade because the metrics they weight are not identical.
Both tools produce waterfall charts, but GTmetrix’s waterfall is more granular. It shows request chains, resource dependencies, and timing breakdowns that Pingdom’s waterfall does not always surface. For diagnosing a specific bottleneck, GTmetrix’s waterfall provides more detail. For spotting a general pattern over time, Pingdom’s historical speed data provides more context.
The overlap is not redundancy. It is a second angle on the same data. When both tools agree that a page is slow, the problem is real and urgent. When they disagree, the discrepancy itself is informative: it tells you that the problem depends on conditions that differ between the two testing environments, which narrows the investigation.
What You Miss Using Only One
Using only Pingdom, you know your site is up and how fast it loads over time. You do not know why it is slow. When Pingdom reports that load time increased by 2 seconds last Tuesday, you have no prioritized fix list, no resource-level waterfall analysis, and no Lighthouse recommendations to act on. You know there is a problem but not what caused it or what to do about it.
Using only GTmetrix, you know exactly what is slowing each page down and how to fix it. You do not know whether the site went down overnight, whether real users on mobile devices are having a worse experience than the lab data suggests, or whether the checkout flow broke after this morning’s deployment. You have the diagnostic detail but no continuous monitoring to catch problems between tests.
The gap between these two tools is where performance problems live undetected. A slow server response that appears intermittently would show up in Pingdom’s continuous monitoring but might not appear in a single GTmetrix test run during a healthy period. A render-blocking script added by a new plugin would show up immediately in GTmetrix’s waterfall but would only appear in Pingdom’s data as a gradual increase in load time over days.
Using both eliminates the blind spots. Pingdom catches the problem. GTmetrix diagnoses the cause. The fix addresses something you would not have found with either tool alone.
How to Use Both Together
The workflow is straightforward once you stop treating these tools as alternatives and start treating them as layers.
Set up Pingdom as your always-on monitoring layer. Configure uptime checks for your most important pages and services. Set page speed monitoring on your top five pages. Configure alerting through Slack, email, or whatever channel your team responds to fastest. This is the early warning system. It runs whether you are watching or not.
Use GTmetrix as your diagnostic layer. When Pingdom flags a speed regression or you notice rankings declining on a specific page, run a GTmetrix test on that page. Review the waterfall for new bottlenecks. Check the Structure audit for quick wins. Compare the lab data against the CrUX field data to see whether real users are affected. Fix the highest-impact issues and retest to confirm.
Run a baseline GTmetrix test on your top pages monthly even when nothing appears wrong. Performance degrades gradually as plugins update, content accumulates, and third-party scripts change. Monthly baselines catch the slow drift before it reaches the threshold where it starts affecting rankings or user experience. The page speed optimization guide covers the specific fixes once the diagnosis is clear.
Log the results. A spreadsheet tracking Pingdom uptime percentage, average response time, and GTmetrix Performance grade per page per month creates a performance history that makes trends visible and gives you evidence to show clients or stakeholders. Two data points are a comparison. Twelve months of data points are a trend line.
Where PageSpeed Insights Fits
Neither Pingdom nor GTmetrix shows you the exact data Google uses for the Core Web Vitals ranking signal. PageSpeed Insights does. It pulls field data from the Chrome User Experience Report, which is the same dataset Google uses to evaluate your page experience for ranking, and displays it alongside Lighthouse lab diagnostics.
This makes PageSpeed Insights the validation layer. Pingdom monitors. GTmetrix diagnoses. PageSpeed Insights confirms whether the problems and fixes are reflected in the data Google actually uses for ranking. A page can score well in GTmetrix and Pingdom while failing its Core Web Vitals assessment in the field because real users on slow devices have a worse experience than the lab predicted.
The strongest speed testing workflow uses all three. Pingdom for continuous monitoring and alerting. GTmetrix for deep diagnostic analysis and historical tracking. PageSpeed Insights for field data validation and direct connection to the ranking signal. Each tool fills a gap the others leave open. The system is stronger than any individual component.
Speed Testing and SEO: The Real Relationship
Speed testing tools do not improve your rankings. They reveal the problems that, once fixed, allow your content and authority signals to perform without a technical anchor dragging them down. The tools are diagnostic. The fixes are what matter. The question of whether speed tests actually matter for SEO has a nuanced answer: the tests themselves are worthless without action, but the problems they uncover can be the difference between page one and page three.
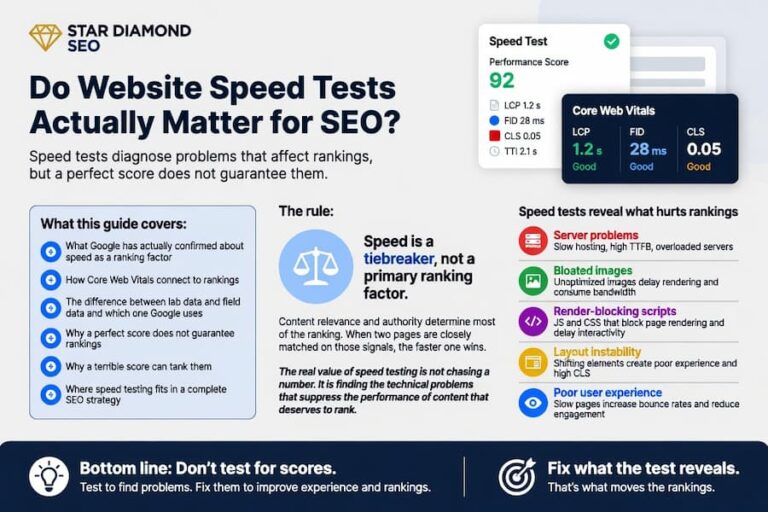
Speed is a tiebreaker in Google’s ranking system, not a primary factor. Content relevance and authority determine most of the ranking. When two pages match closely on those signals, the faster page can win the higher position. When a page fails Core Web Vitals thresholds badly enough, it gets suppressed regardless of how good the content is because visitors leave before they engage with it.
That makes speed testing part of the technical SEO layer, one component of the foundation that supports content and authority. It belongs alongside your on-page optimization, your crawlability audit, and your site architecture. None of these elements work in isolation. A fast site with weak content does not rank. Strong content on a slow, unreliable site loses the visitors and crawl coverage it needs to rank. The system works when every layer performs.
The role of Pingdom and GTmetrix in that system is making sure the technical layer is not the weak link. Pingdom ensures you know about failures in real time. GTmetrix ensures you know exactly what to fix. Together, they keep the foundation solid so the rest of the strategy can do its job.
FAQ
Is Pingdom or GTmetrix better for SEO?
Neither tool is better for SEO on its own because they serve different purposes. GTmetrix provides the diagnostic detail needed to identify and fix specific performance problems that affect Core Web Vitals. Pingdom provides continuous monitoring that catches outages and speed regressions before they accumulate enough damage to affect rankings. Using both together gives a more complete picture of your site’s technical health than either one alone.
Can I use Pingdom and GTmetrix together?
Yes, and that is the recommended approach. Set up Pingdom as your continuous monitoring layer to track uptime and speed trends around the clock. Use GTmetrix as your diagnostic layer to investigate specific performance problems when they appear. Run monthly GTmetrix baselines on your top pages to catch gradual degradation. The two tools complement each other because they measure different things from different angles.
What does Pingdom do that GTmetrix does not?
Pingdom provides continuous uptime monitoring from over 100 global locations with 60-second check intervals, real user monitoring that captures performance data from actual visitors, synthetic transaction monitoring that tests multi-step user flows like checkouts and logins, and SMS and integration-based alerting when something goes wrong. GTmetrix does not monitor uptime, does not capture real user data, and does not test transactional workflows.
What does GTmetrix do that Pingdom does not?
GTmetrix runs Lighthouse-based performance analysis that produces detailed Core Web Vitals scores, Structure grades evaluating optimization best practices, granular waterfall charts showing resource-level timing and dependencies, Speed Visualization with video playback of the rendering process, and prioritized fix recommendations with estimated time savings. Pingdom does not run Lighthouse and does not provide this level of diagnostic detail.
Is there a free option for either tool?
GTmetrix offers a free tier that includes on-demand testing from 7 global locations, Lighthouse performance and structure grades, waterfall charts, and video playback. The free tier does not include scheduled monitoring, API access, or mobile device simulation. Pingdom does not offer a permanently free tier but provides a 14-day free trial with no credit card required. Both tools offer spot checks without an account for quick one-time tests.
Do Pingdom and GTmetrix give different speed scores for the same page?
Yes, and that is expected. Pingdom and GTmetrix use different scoring methodologies, test from different locations by default, and weight different metrics in their grades. Pingdom measures total load time using a real browser. GTmetrix produces a Lighthouse Performance score based on LCP, TBT, and CLS. A page can score well in one tool and poorly in the other because they are measuring different aspects of performance. The discrepancy is informative, not a sign that one tool is wrong.
How often should I run speed tests?
Set Pingdom to monitor your top pages continuously with 60-second or hourly checks. Run GTmetrix baselines on your top pages monthly and immediately after any significant site change such as a theme update, plugin installation, or hosting migration. Run PageSpeed Insights checks quarterly to validate that your Core Web Vitals field data aligns with what the lab tools are showing. Test after every change, baseline monthly, validate quarterly.
Which tool should I start with if I can only afford one?
Start with GTmetrix’s free tier. It provides the diagnostic detail needed to identify and fix the most impactful performance problems on your site at no cost. Once those fixes are in place and your site performs well in lab testing, add Pingdom monitoring to ensure the performance holds over time. The diagnostic work comes first because there is no value in monitoring a site you have not optimized yet.