What Is Pingdom? A Complete Guide to Website Speed Monitoring
AI Summary
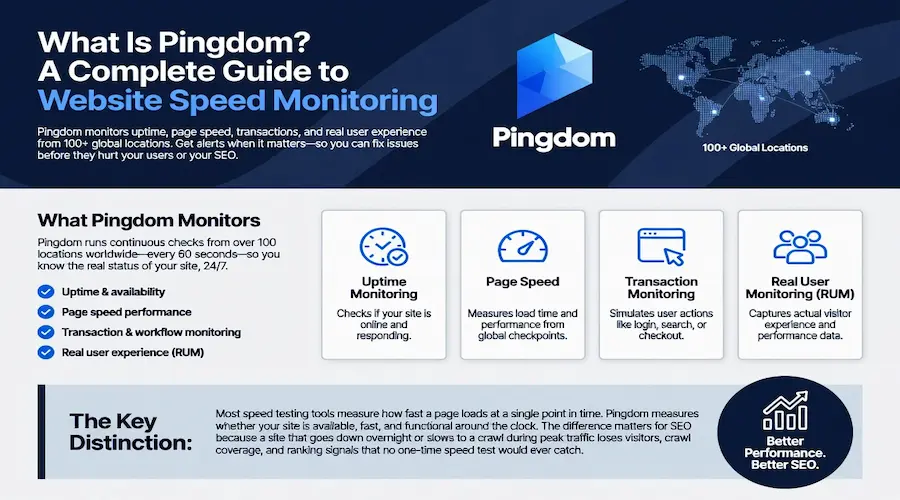
Pingdom is a website monitoring platform owned by SolarWinds that tracks uptime, page speed, synthetic transactions, and real user experience from over 100 global locations. Unlike lab-only testing tools, Pingdom runs continuous checks every 60 seconds and alerts you when something goes down, slows down, or breaks. It answers the question most speed testing tools ignore: is your site actually working right now?
What this guide covers: What Pingdom monitors and how, the four core capabilities (uptime, page speed, transactions, RUM), how the dashboard and alerting system work, pricing and plan structure, integrations, and where Pingdom fits alongside other speed testing tools in an SEO workflow.
The key distinction: Most speed testing tools measure how fast a page loads at a single point in time. Pingdom measures whether your site is available, fast, and functional around the clock. The difference matters for SEO because a site that goes down overnight or slows to a crawl during peak traffic loses visitors, crawl coverage, and ranking signals that no one-time speed test would ever catch.
What Is Pingdom?
Pingdom is a website monitoring platform built to answer one question continuously: is your site up, fast, and working? It was founded in Sweden in 2007 and acquired by SolarWinds, where it now operates as part of their observability product suite. Over 850,000 users rely on Pingdom to monitor websites, APIs, CDNs, DNS, email servers, and network services across more than 100 probe locations worldwide.
What separates Pingdom from tools that only run one-time speed tests is persistence. A one-time test gives you a snapshot. Pingdom runs checks every 60 seconds, 24 hours a day, from multiple locations simultaneously. If your site goes down at 3 AM and comes back at 5 AM, Pingdom knows. If your server response time doubles during a traffic spike, Pingdom catches it. If a checkout flow breaks after a plugin update, Pingdom detects it. The monitoring never stops, which means the gaps that periodic testing misses do not exist.
Pingdom provides four core capabilities: uptime monitoring, page speed monitoring, synthetic transaction monitoring, and real user monitoring. Each one measures a different dimension of your site’s health. Together, they give a comprehensive view of availability and performance that no single testing tool can replicate.
Uptime Monitoring
Uptime monitoring is Pingdom’s foundational feature. It checks whether your website, API, or service is reachable from the outside world. When a check fails, Pingdom sends an alert through email, SMS, or any connected integration so you know about the outage before your visitors do.
Checks run from over 100 probe locations distributed globally. This geographic distribution matters because a site can be reachable from one region and completely down in another due to DNS issues, CDN misconfigurations, or regional network problems. Testing from a single location would report the site as healthy while visitors in another region see an error page.
Pingdom monitors more than just HTTP responses. It checks TCP connections, DNS resolution, SMTP mail servers, POP3 and IMAP mail retrieval, and custom UDP services. This means you can monitor your entire infrastructure, not just the website itself. If the mail server goes down, if the API endpoint stops responding, if the DNS provider has an outage, Pingdom flags it.
Uptime monitoring also generates public status pages. These are hosted pages that display the current operational status of your services, which you can share with clients or users. When an incident occurs, the status page updates automatically, reducing the volume of support inquiries from people asking whether the site is down.
Page Speed Monitoring
Pingdom’s page speed monitoring tests how quickly a specific URL loads from a real browser at a selected global location. Unlike lab-only tools that run simulated Lighthouse tests, Pingdom loads the page in an actual browser environment, which captures behaviors that synthetic testing sometimes misses: third-party script delays, ad network latency, and CDN cache inconsistencies that only appear under real loading conditions.
The Pingdom speed test produces a waterfall chart showing every resource request, a performance grade based on optimization best practices, and summary metrics including page size, load time, and request count. The waterfall reveals the causal chain: which resources block rendering, which ones load sequentially when they could load in parallel, and which third-party scripts add disproportionate weight.
Where Pingdom’s page speed monitoring gains an edge over one-time tests is scheduled monitoring. You can set a page to test hourly or daily from a specific location and track performance over time. This turns speed testing from a periodic chore into a continuous signal. If a theme update adds 800 milliseconds to load time, the trend line shows it immediately instead of waiting until someone notices the site feels slow.
The speed data also connects to Core Web Vitals in a practical way. While Pingdom does not run Lighthouse directly, the problems it identifies, including oversized images, render-blocking scripts, and slow server response, are the same problems that degrade Largest Contentful Paint and Cumulative Layout Shift scores. Fixing what Pingdom flags often improves the Core Web Vitals that Google measures for ranking.
Synthetic Transaction Monitoring
Transaction monitoring goes beyond checking whether a page loads. It scripts and simulates multi-step user interactions: logging in, searching for a product, adding an item to a cart, completing a checkout, submitting a form. Pingdom runs these scripted transactions on a schedule and alerts you when any step fails or slows below a defined threshold.
This capability matters because a site can be “up” and “fast” while a critical workflow is broken. A checkout page that loads in 1.2 seconds but throws a JavaScript error when the user clicks “Place Order” is functionally down for every customer who tries to buy something. Uptime monitoring would report it as healthy. Page speed monitoring would report it as fast. Only transaction monitoring would catch the broken flow.
Transaction monitors use what Pingdom calls “advanced checks.” Each scripted transaction consumes one advanced check slot, which is included at different quantities depending on your plan tier. The scripts define each step of the interaction: navigate to URL, enter text in a field, click a button, verify an element appears. If any step fails or exceeds the time threshold, the alert fires.
For sites where a specific user flow directly generates revenue, transaction monitoring provides a safety net that no other monitoring type replaces. The value is not in measuring speed. The value is in confirming that the thing your business depends on still works.
Real User Monitoring
Real User Monitoring captures performance data from your actual visitors as they browse your site. Unlike synthetic monitoring, which tests from controlled servers, RUM reflects the real experience: the slow phone on a 3G connection in rural Brazil, the enterprise laptop behind a corporate proxy in London, the iPad on airport WiFi in Chicago.
Pingdom RUM tracks active sessions, page load times, bounce rates, and geographic distribution of visitors. This data reveals patterns that synthetic tests cannot predict. You might discover that visitors from Southeast Asia experience load times three times longer than visitors from North America because your CDN has no edge nodes in that region. That insight only comes from measuring real users, not from running a test from a server in Vancouver.
RUM is sold as a separate product from Pingdom’s synthetic monitoring, with its own pricing based on pageview volume. This means you can run synthetic monitoring without RUM, or add RUM when you need the real-visitor data layer. For SEO purposes, RUM data is particularly valuable because Google’s Core Web Vitals ranking signal uses field data from real Chrome users. Pingdom RUM gives you a parallel view of real user experience so you can identify problems before they show up in Google’s Chrome User Experience Report with its 28-day rolling window.
The Pingdom Dashboard and Alerting
The Pingdom dashboard centralizes all monitoring data into a single view. Uptime status, response times, current incidents, and historical performance trends are visible without clicking into individual monitors. The layout prioritizes what needs attention: active incidents at the top, degraded services highlighted, healthy services listed below.
Alerting is configurable per monitor. You define who gets notified, through which channel, and under what conditions. A minor slowdown might send an email. A full outage might trigger SMS, Slack, and PagerDuty simultaneously. You can set escalation rules so that if the first responder does not acknowledge the alert within a defined window, it escalates to the next person. This prevents the situation where an alert fires at 2 AM and nobody sees it until morning.
Historical data in the dashboard shows uptime percentages and response time trends over days, weeks, or months. This data serves two purposes. Internally, it identifies patterns: recurring slowdowns at the same time each day might indicate a cron job competing for server resources. Externally, it provides evidence for clients or stakeholders. Showing a 99.95% uptime record over 12 months is more convincing than saying “the site is reliable” without data.
Pingdom also supports TV dashboards, which display monitoring status on wall-mounted screens in offices or operations centers. This provides passive visibility to the team without requiring anyone to log into the application to check status.
Integrations and API
Pingdom integrates with the tools teams already use for incident response and communication. Native integrations include Slack, Microsoft Teams, PagerDuty, Splunk, Datadog, and OpsGenie. Webhooks allow connections to any system that accepts HTTP callbacks, and Zapier support extends connectivity to platforms like Shopify, HubSpot, and hundreds of others.
The Pingdom REST API provides programmatic access to all monitoring functions. You can create, modify, and delete checks, retrieve performance data, pull uptime reports, and manage alerting rules through API calls. This enables automation: spinning up monitors for new client sites as part of an onboarding workflow, pulling performance data into custom reporting dashboards, or integrating monitoring checks into a deployment pipeline that verifies the site is healthy after each release.
For agencies managing multiple client sites, the API is what turns Pingdom from a monitoring tool into a monitoring infrastructure. Instead of manually configuring checks for each new client, a script can create the full monitoring setup in seconds and feed the data back into the agency’s reporting system.
Pricing and Plans
Pingdom does not offer a permanently free tier. There is a 14-day free trial with no credit card required, which provides enough time to evaluate whether the platform fits your monitoring needs.
Pricing splits into two independent products that can be purchased separately or together: Synthetic Monitoring and Real User Monitoring.
Synthetic Monitoring plans are tiered by the number of uptime checks and advanced monitors included. The Starter tier begins at $15 per month and covers basic uptime and page speed monitoring. The Standard tier at $50 per month adds more checks and transaction monitoring capacity. The Advanced tier at $95 per month provides the highest check volume and priority in the testing queue. All plans include SSL monitoring and email alerts by default. SMS alerts are included with allotted credits.
Real User Monitoring is priced separately based on pageview volume. Adding RUM to an existing synthetic plan gives you the field data layer that shows what actual visitors experience, complementing the scheduled synthetic checks that test from controlled environments.
For teams spending above $500 per month or requiring custom monitoring configurations, SolarWinds offers enterprise pricing with volume commitments and multi-year contract options. Annual billing typically saves 15 to 40 percent compared to monthly billing across all tiers.
Pingdom vs Other Speed Testing Tools
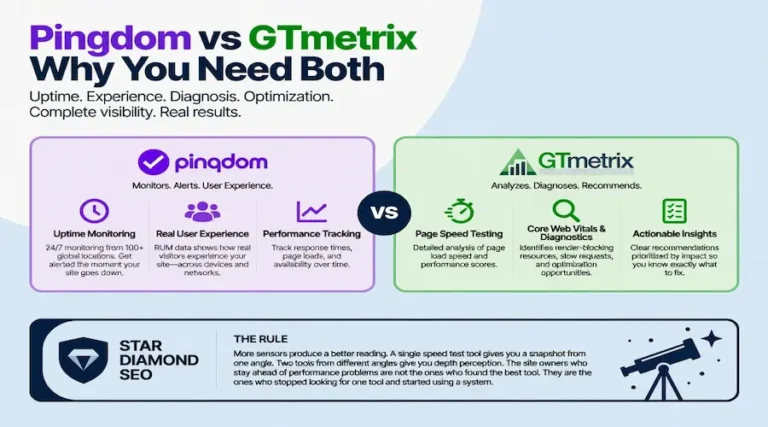
Pingdom occupies a different position in the monitoring landscape than tools like GTmetrix and PageSpeed Insights. Understanding what each tool does best prevents you from relying on one where another would give better data.
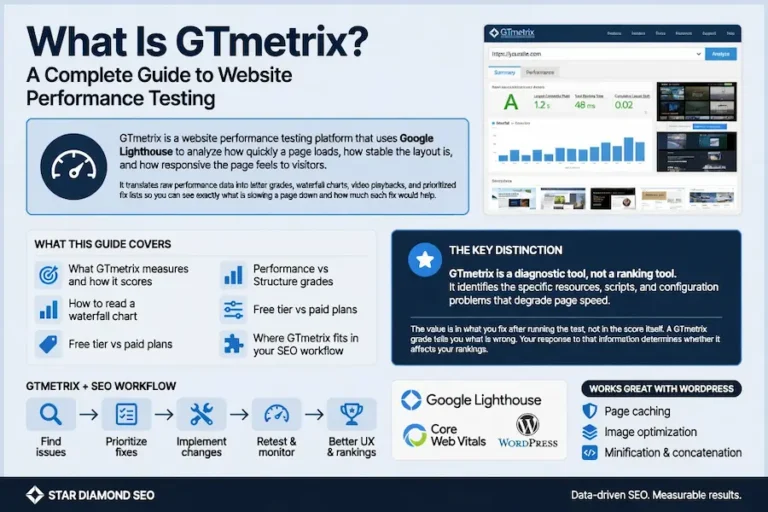
GTmetrix uses Lighthouse to produce detailed performance grades, waterfall breakdowns, and specific optimization recommendations. Its strength is diagnostic depth. When you need to understand exactly why a page is slow and which specific resources to fix first, GTmetrix provides more granular analysis than Pingdom’s page speed test. Pingdom does not run Lighthouse and does not produce Structure grades or prioritized fix lists the way GTmetrix does.
PageSpeed Insights connects Lighthouse lab data with Chrome User Experience Report field data. Its unique advantage is showing the actual data Google uses for the Core Web Vitals ranking signal alongside diagnostic recommendations. Neither Pingdom nor GTmetrix provides that direct connection to the ranking signal.
Where Pingdom stands alone is continuous monitoring. GTmetrix and PageSpeed Insights are testing tools. You run them when you want a report. Pingdom runs around the clock whether you are watching or not. It catches the 3 AM outage, the traffic spike that crashes the server, the broken checkout flow after a midnight deployment. For a deeper look at how Pingdom and GTmetrix complement each other and why using both produces better results than either one alone, the comparison guide covers the full breakdown.
Where Pingdom Fits in an SEO Workflow
Pingdom belongs in the technical SEO layer as a monitoring tool, not a testing tool. The distinction matters. A testing tool tells you how fast a page loads at one moment. A monitoring tool tells you whether the site has been available, fast, and functional over time. Both are necessary, and they serve different purposes.
The SEO impact of uptime is direct. Every minute your site is down, Googlebot cannot crawl it. If the downtime coincides with a scheduled crawl, pages that should have been re-evaluated are skipped. If downtime happens frequently enough, crawl budget gets wasted on failed requests instead of indexing content. Pingdom’s uptime monitoring ensures you know about outages when they happen, not after the damage has already affected your crawlability and indexing.
Server response time, which Pingdom tracks continuously, directly affects how efficiently Googlebot crawls your site. A server that responds in 200 milliseconds lets Googlebot crawl five times as many pages per session as a server that responds in 1,000 milliseconds. If your server response time degrades gradually over months, periodic speed tests might miss the trend. Pingdom’s historical data shows it clearly because the measurement never stops.
The rhythm of monitoring connects to the broader practice of measuring and adjusting that keeps every layer of your SEO performing. Speed tests give you snapshots. Monitoring gives you the continuous signal that tells you whether the technical foundation is holding or degrading. A comprehensive speed testing workflow uses both: Pingdom for the continuous signal, one-time tests like PageSpeed Insights and GTmetrix for the diagnostic detail when Pingdom flags a problem worth investigating. The SEO knowledge base covers how all of these layers, from technical monitoring to content strategy to authority building, work together as a system.
FAQ
What is Pingdom used for?
Pingdom is used for continuous website monitoring across four capabilities: uptime monitoring that checks whether your site is reachable every 60 seconds from over 100 global locations, page speed monitoring that tracks load times over time, synthetic transaction monitoring that simulates multi-step user flows like checkouts and logins, and real user monitoring that captures performance data from actual visitors on their own devices and connections.
Is Pingdom free?
Pingdom does not offer a permanently free tier. It provides a 14-day free trial with no credit card required. After the trial, paid plans for synthetic monitoring start at $15 per month for the Starter tier. Real user monitoring is priced separately based on pageview volume. Annual billing reduces the cost by 15 to 40 percent compared to monthly billing.
Who owns Pingdom?
Pingdom is owned by SolarWinds. It was originally founded in Sweden in 2007 as an independent website monitoring service. SolarWinds acquired Pingdom and integrated it into their observability product suite. The platform is now marketed as SolarWinds Pingdom and serves over 850,000 users globally.
What is the difference between Pingdom and GTmetrix?
Pingdom is a continuous monitoring platform that checks uptime, speed, transactions, and real user experience around the clock and alerts you when something goes wrong. GTmetrix is a diagnostic testing tool that uses Lighthouse to produce detailed performance grades, waterfall analysis, and specific optimization recommendations. Pingdom tells you whether the site is working. GTmetrix tells you why it is slow and what to fix. They serve different purposes and work best when used together.
Does Pingdom monitor uptime?
Yes. Uptime monitoring is Pingdom’s core capability. It checks your website, API, DNS, mail server, or any network service from over 100 global probe locations as frequently as every 60 seconds. When a check fails, Pingdom sends alerts through email, SMS, Slack, PagerDuty, or other configured integrations so you know about the outage immediately.
How many probe locations does Pingdom have?
Pingdom operates over 100 probe locations distributed globally. This geographic distribution allows it to detect regional outages and performance problems that would be invisible to a monitoring tool testing from a single location. A site can be reachable from North America and completely down in Europe due to a DNS or CDN issue, and Pingdom’s multi-location checks would catch the discrepancy.
Does Pingdom affect SEO?
Pingdom itself does not affect SEO. It is a monitoring tool, not a ranking factor. However, the problems Pingdom detects, including downtime, slow server response, and broken user flows, directly affect crawlability, user experience, and engagement signals that influence rankings. Knowing about these problems immediately through Pingdom’s alerting system lets you fix them before they accumulate enough damage to impact search performance.
What integrations does Pingdom support?
Pingdom integrates natively with Slack, Microsoft Teams, PagerDuty, Splunk, Datadog, and OpsGenie. It also supports webhooks for custom integrations and Zapier for connecting to platforms like Shopify and HubSpot. The Pingdom REST API provides full programmatic access to create, modify, and manage monitoring checks, retrieve performance data, and automate reporting workflows.