Largest Contentful Paint: What LCP Is and How to Improve It
AI Summary
What is Largest Contentful Paint? Largest Contentful Paint, or LCP, is the Core Web Vital that measures loading speed. It times how long it takes for the largest visible content element in the viewport to render, usually a hero image, a large heading, or the main text block above the fold. It is the metric that answers the visitor’s first question: when can I see the thing I came here for? Google’s threshold for good LCP is 2.5 seconds or less.
What it is and who it is for: This guide covers what LCP measures, which elements qualify, the four phases that make up the total LCP time, what causes slow LCP, how to test it, how to fix it on any platform including WordPress, how images and fonts affect LCP, the relationship between LCP and server response time, and how LCP affects rankings. It is for site owners, developers, and SEO practitioners who need to move past the number and understand what drives it.
The rule: LCP breaks into four phases: server response, resource load delay, resource load time, and render delay. The fix lives in whichever phase owns the most time. Optimizing images while running on a slow server is fixing the wrong phase. Identify which phase holds your time, and that is where the work goes.
What LCP Measures
Largest Contentful Paint measures the render time of the largest content element visible in the viewport, timed from when the page first starts loading. The key word is visible. LCP only cares about what is above the fold, in the initial viewport, because that is what the visitor sees while they wait. An enormous image far down the page does not count. The largest thing in the first screen does.
LCP exists because it captures the moment a page becomes useful. Other loading metrics measure technical milestones that do not map to human perception. First Contentful Paint fires when the first pixel of content appears, which might just be a logo or a navigation bar. LCP fires when the main content arrives, which is the moment the visitor actually came for. It is the closest single metric to answering “has the page loaded yet” the way a real person would judge it.
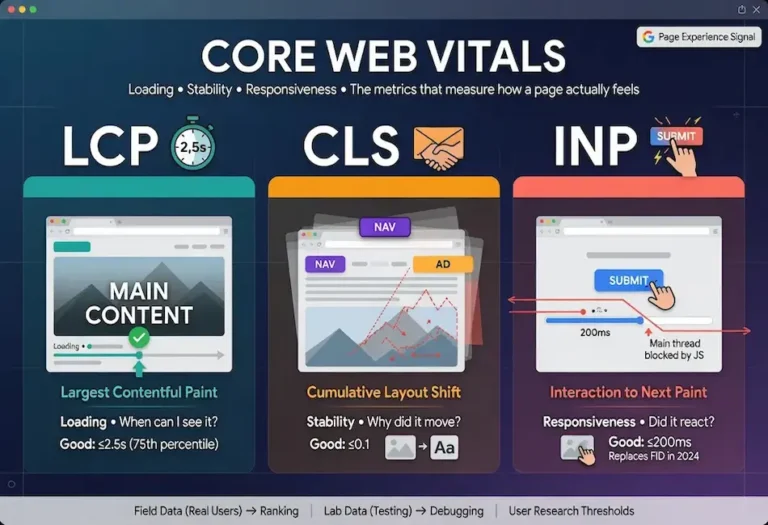
It is one of the three Core Web Vitals Google uses to measure page experience. Alongside Cumulative Layout Shift for stability and Interaction to Next Paint for responsiveness, LCP handles the loading dimension. Of the three, LCP is the most intuitive because every internet user understands waiting for a page to appear. The metric simply puts a number on that wait.
The LCP Threshold
Google’s threshold for good LCP is 2.5 seconds or less. Between 2.5 and 4 seconds is “needs improvement.” Above 4 seconds is “poor.” Like all Core Web Vitals, LCP is measured at the 75th percentile of real user page loads, which means the score reflects your slower quarter of visitors, not your average.
That percentile detail changes how you should read your own data. If a testing tool shows your LCP at 2.5 seconds, that is not the experience of a typical visitor. It is the experience at the boundary where 25 percent of your traffic is having a worse time. Your median visitor might be seeing 1.8 seconds while a meaningful slice is waiting four or five. Optimizing LCP means lifting that slower tail, not just improving the average, because the slower tail is what the score measures and what Google ranks on.
The threshold is based on user research, not arbitrary benchmarks. Google studied the perception thresholds at which users begin to notice delays and feel frustration. 2.5 seconds is the point where a noticeable percentage of users start to perceive the page as slow. Below that, the loading feels natural. Above it, impatience sets in. The threshold is not a target to barely reach. It is the ceiling above which the experience degrades in a way that is measurable both in user behavior and in the ranking signal Google applies.
What Counts as the LCP Element
Not every element on the page is a candidate for LCP measurement. The browser considers a specific set of element types and selects the largest one by rendered area in the viewport. Understanding which elements qualify is the first step in fixing LCP, because you cannot optimize the LCP element until you know what it is.
The qualifying element types are: img elements, image elements inside svg, video elements (the poster image is used), elements with a background image loaded via CSS url(), and block-level elements containing text nodes (headings, paragraphs, divs with text). The browser tracks which candidate is largest as the page loads, updating the LCP candidate as new elements render. The final LCP measurement is taken when the user first interacts with the page (click, tap, scroll, or keypress), at which point the current largest candidate becomes the official LCP element.
On most content pages, the LCP element is the hero image. On text-heavy pages without a large above-the-fold image, the LCP element is typically the main heading or the first paragraph of body text. On e-commerce product pages, it is usually the product image. The practical move is to run PageSpeed Insights on the page and look at the “Largest Contentful Paint element” diagnostic. It tells you exactly which element was measured, which eliminates guesswork about what to optimize.
One nuance that catches people: if the LCP element is a text block, LCP fires as soon as the text renders, which is typically very fast if there is no render-blocking CSS or JavaScript. If the LCP element is an image, LCP cannot fire until the image downloads and paints. This is why pages with large hero images almost always have slower LCP than text-first pages, and why the decision about whether to use a hero image is a direct tradeoff between visual design and loading speed.
The Four Phases of LCP
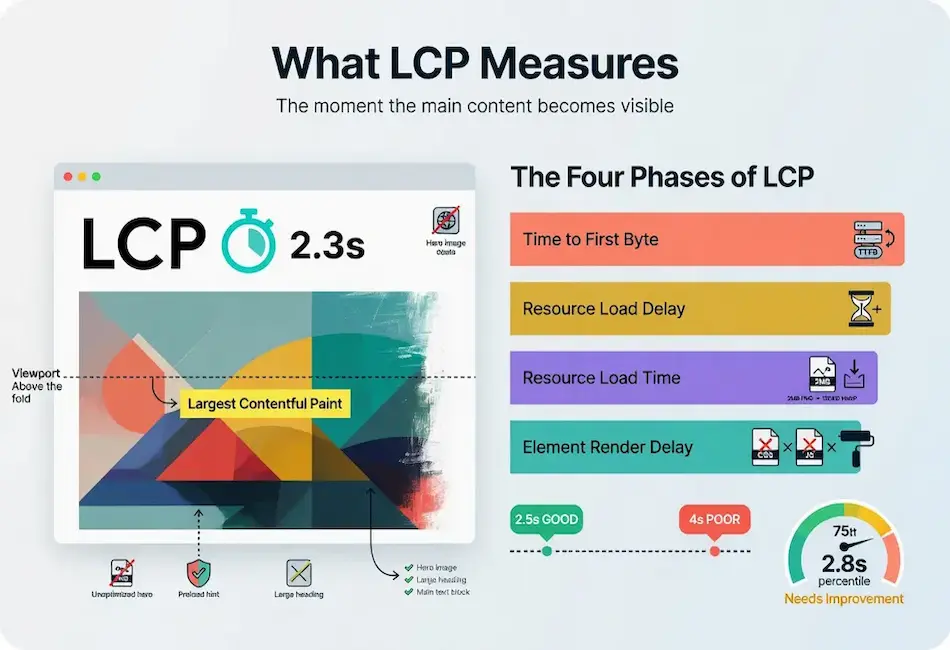
The single most useful way to think about LCP, and the framing that makes fixing it tractable, is to break the total time into four sequential phases. Every millisecond of your LCP falls into one of these four buckets, and knowing which bucket holds most of your time tells you exactly where to work.
Phase 1: Time to First Byte (TTFB). The time from the start of navigation to the moment the server sends the first byte of the HTML response. This is server and network time. If your TTFB is slow, every other phase starts late no matter how well optimized it is. TTFB is the foundation. A target of under 200 milliseconds is good. Under 600 milliseconds is acceptable. Above 600 milliseconds, the server itself is the bottleneck and no amount of front-end optimization will compensate.
Phase 2: Resource load delay. The gap between when the HTML arrives and when the browser starts downloading the LCP element. If the LCP image is referenced deep in a CSS file rather than in the HTML, the browser does not discover it until it parses that CSS. If render-blocking scripts sit between the HTML and the LCP element, the browser stalls before it can even begin the download. This phase grows when the LCP resource is hidden from early discovery.
Phase 3: Resource load time. The time it takes to actually download the LCP element once the browser starts fetching it. A large unoptimized image makes this phase long. A 3 MB hero image on a mobile connection can consume the entire LCP budget in this phase alone. Compression, proper sizing, and modern formats attack this phase directly.
Phase 4: Element render delay. The gap between the LCP resource finishing its download and the element actually painting on screen. Render-blocking CSS and JavaScript inflate this phase because the browser cannot paint until it finishes processing them. A page that downloads the LCP image in 1 second but then waits another second for CSS and JavaScript to process before painting has a render delay problem.
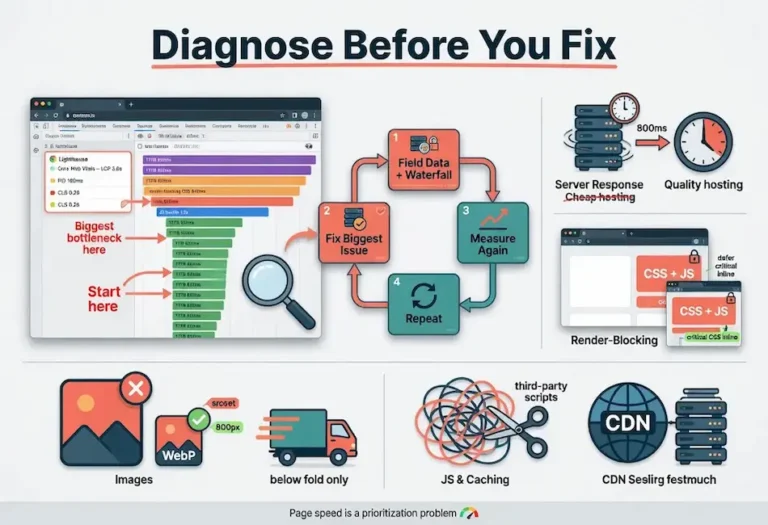
When you profile a page using a tool that breaks LCP into these phases, the fix becomes obvious. A long TTFB points at hosting or backend. A long resource load delay points at late discovery of the LCP element. A long resource load time points at image optimization. A long render delay points at render-blocking code. You stop guessing and start working on the phase that actually owns your time.
What Causes a Slow LCP
Mapped to the phases, the causes are predictable. Each one slots into a specific phase, and understanding which phase it belongs to prevents you from applying the wrong fix.
Slow Server Response
Cheap shared hosting, an unoptimized backend, or missing server-side caching inflates TTFB. The server is the foundation, and a slow one caps everything above it. A server that takes 1.5 seconds to respond leaves only 1 second for everything else if the page needs to hit a 2.5-second LCP. No amount of image compression fixes a TTFB problem.
Render-Blocking Resources
CSS in the document head blocks rendering by design, and JavaScript that is not deferred or made asynchronous blocks the HTML parser. The browser has to download, parse, and execute these before it can paint the LCP element. A page loading a dozen render-blocking stylesheets and scripts will struggle to hit a good LCP no matter how small the images are. This lands the delay in the render phase and is one of the most common causes on sites using multiple plugins or theme frameworks.
Large Unoptimized Images
A hero image saved as a 2 MB PNG when it could be a 150 KB WebP adds seconds to the resource load phase. This is the most common single cause and the easiest to fix. The image is usually the LCP element itself, so every byte of unnecessary weight translates directly into slower LCP. Serving a 3000-pixel image when the display size is 800 pixels wastes bandwidth downloading pixels that are never shown.
Late Discovery of the LCP Resource
When the LCP image is referenced in a CSS background-image rule rather than in an HTML img tag, the browser cannot discover it until it downloads and parses the CSS file. This adds the entire CSS download and parse time to the resource load delay phase before the image download even begins. Similarly, JavaScript-inserted images (lazy loaded hero images, or images rendered by a client-side framework) are invisible to the browser until the JavaScript executes.
Client-Side Rendering
JavaScript frameworks that build the page in the browser mean the LCP element does not exist in the initial HTML. The browser downloads the JavaScript bundle, parses it, executes it, renders the component tree, and only then does the LCP element appear. This architecture pushes LCP time into every phase simultaneously: the JavaScript is both render-blocking and the mechanism that creates the LCP element.
How to Test LCP
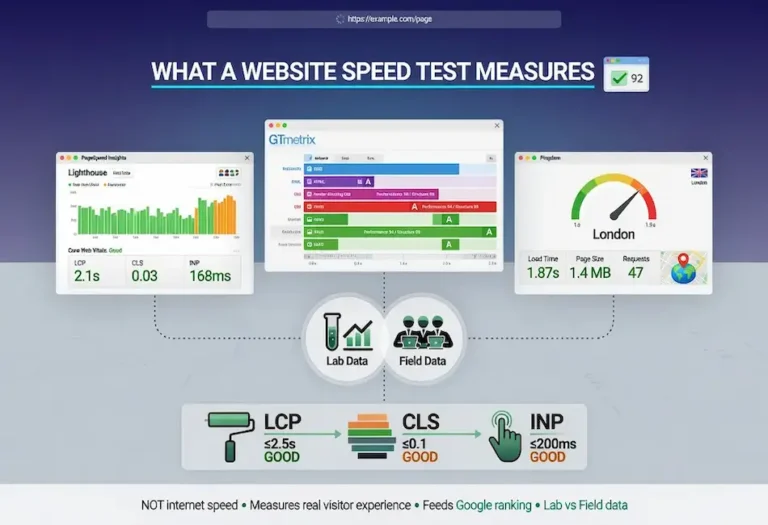
LCP testing follows the same field-first, lab-second approach as the other Core Web Vitals. The field data is what Google ranks on. The lab data is what you use to diagnose and verify fixes.
Field Data
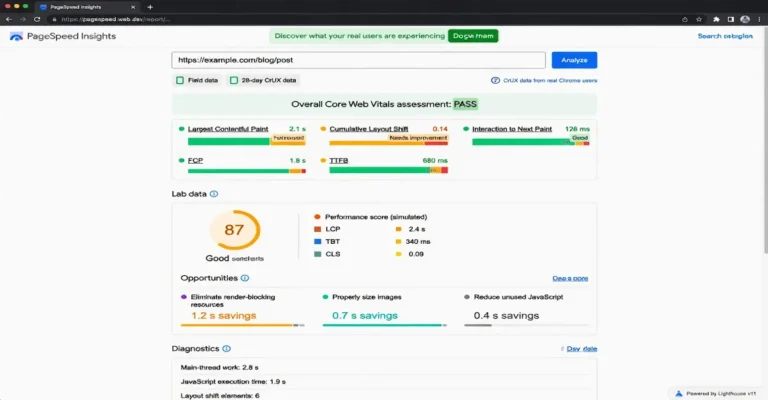
The Core Web Vitals report in Google Search Console shows your LCP field data grouped by URL status: good, needs improvement, or poor. PageSpeed Insights shows the same CrUX field data at the page level. When field data is available, it takes priority over any lab measurement because it reflects what real users on real devices actually experienced over the past 28 days.
Lab Data
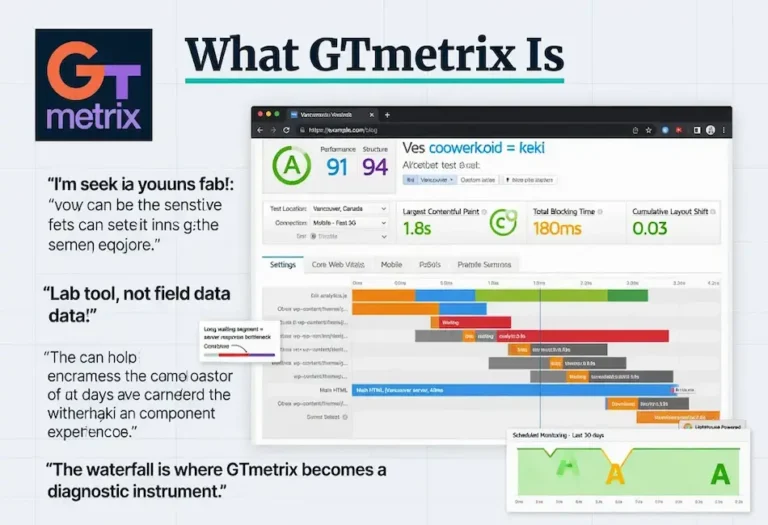
PageSpeed Insights runs a Lighthouse audit that provides lab LCP with specific diagnostics. It identifies the LCP element, flags render-blocking resources, and estimates time savings for each recommended fix. GTmetrix provides the same Lighthouse-based measurement with historical tracking. Pingdom does not report LCP directly, but its waterfall chart shows the timing of every resource load, which lets you identify the specific file causing the delay.
Chrome DevTools
The Performance panel in Chrome DevTools is the most precise diagnostic tool for LCP. Record a page load and look for the LCP marker in the timeline. Hover over it to see which element was measured and how long each phase took. The panel breaks the total LCP into the four phases (TTFB, resource load delay, resource load time, render delay), which directly points you at the phase that needs work. This is the tool that turns a generic “LCP is slow” observation into a specific “the hero image takes 1.8 seconds to download because it is 2.4 MB” diagnosis.
The complete testing framework, including when to use each tool and how they connect, is covered in the website speed test guide.
How to Improve LCP
Fix the phase that owns your time, in order of where the time actually is. Working on the wrong phase wastes effort and produces no measurable improvement. The page speed optimization guide covers the full priority sequence. Here is the LCP-specific version.
Fix TTFB First
Better hosting, server-level caching, and a CDN that serves content from a location near the user. Cheap hosting is the most common bottleneck and the one people are most reluctant to spend on, but it is frequently the highest-leverage fix. A faster server improves every page on the site at once. Server-side page caching (serving static HTML instead of rebuilding from PHP and database on every request) is the single most impactful WordPress optimization for TTFB.
Eliminate Render-Blocking Resources
Inline the critical CSS needed for above-the-fold content and defer the rest. Defer or async non-critical JavaScript so it does not block the parser. This is detailed work but it directly attacks the render delay phase, and on script-heavy sites it can cut a second or more off LCP. The goal is ensuring the browser can paint the LCP element as soon as the resource arrives, without waiting for unrelated CSS and JavaScript to finish processing.
Preload the LCP Element
Adding a preload hint in the HTML head tells the browser to start downloading the LCP resource immediately, before it encounters the element in the markup. This attacks the resource load delay phase by eliminating late discovery. For an LCP hero image, the preload looks like: <link rel=”preload” as=”image” href=”/path/to/hero.webp”>. One caution: preloading too many resources backfires because it forces the browser to compete for bandwidth. Preload the LCP element and little else.
Optimize the LCP Image
Serve the image in a modern format like WebP or AVIF. Compress it appropriately for the visual quality needed. Size it correctly for the viewport rather than serving a desktop image to a phone. Use responsive images with srcset so the browser downloads the smallest version that fits the device. Every unnecessary byte in the LCP image translates directly to slower LCP because the resource load time phase is entirely determined by file size and connection speed.
Avoid Lazy Loading the LCP Element
Lazy loading defers image downloads until the image enters the viewport. For below-the-fold images, this is good practice. For the LCP element, which is above the fold by definition, lazy loading delays the most important image on the page. If the hero image has loading=”lazy”, the browser waits to download it until it scrolls into view, which for an above-the-fold image means waiting for the JavaScript observer to fire instead of downloading immediately. Remove lazy loading from the LCP image. WordPress applies lazy loading to all images by default since version 5.5, and the LCP image needs an explicit exception.
LCP and Image Optimization
Images are the LCP element on the majority of pages, which makes image optimization the most common LCP fix. The optimization has three dimensions: format, size, and delivery.
Format
WebP produces files 25% to 35% smaller than JPEG at equivalent visual quality. AVIF pushes that further, typically 30% to 50% smaller than JPEG, though browser support is narrower. Serving the LCP image in WebP with an AVIF source for supporting browsers is the optimal configuration. PNG should only be used when the image requires transparency, and even then WebP supports transparency at smaller file sizes.
Size
Serve the image at the dimensions it will display, not larger. A hero image that renders at 800 pixels wide on desktop should be served at 800 pixels wide, not at the original 4000-pixel camera resolution. For responsive layouts, use the srcset attribute to provide multiple sizes and let the browser choose the appropriate one based on viewport width and device pixel ratio. The sizes attribute tells the browser how wide the image will display at each viewport, which allows it to select the correct source before layout is calculated.
Delivery
Preload the LCP image with a link rel=”preload” tag in the head so the browser begins downloading it as early as possible. Serve it from a CDN so the download originates from a server geographically close to the visitor. Avoid serving the LCP image through a JavaScript-based image optimization service that requires an additional DNS lookup and connection before the download begins, because that added latency inflates the resource load delay phase.
For responsive preloading, the imagesrcset and imagesizes attributes on the preload link allow the browser to preload the correct responsive image variant: <link rel=”preload” as=”image” imagesrcset=”hero-800.webp 800w, hero-1200.webp 1200w” imagesizes=”100vw”>. This ensures the preload fetches the same file the img element would select, not a different size that wastes bandwidth.
LCP and Web Fonts
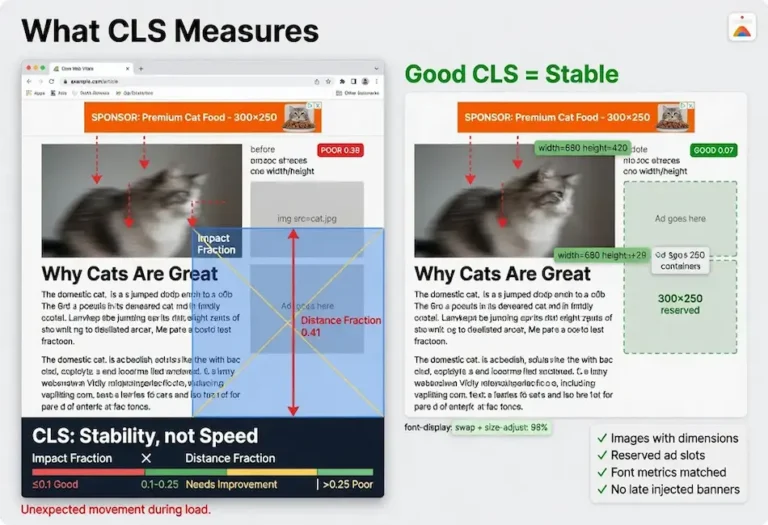
When the LCP element is a text block rather than an image, web font loading directly affects LCP. If the custom font is set to font-display: block, the browser hides the text entirely until the font downloads, which means the LCP element is invisible until the font arrives. If it is set to font-display: swap, the text renders immediately in the fallback font and then swaps to the custom font when it loads. Swap is better for LCP because the text is visible sooner, but it can cause layout shift if the fallback and custom fonts have different metrics.
The ideal configuration for LCP is font-display: swap combined with a fallback font that closely matches the custom font’s metrics. The CSS @font-face size-adjust, ascent-override, descent-override, and line-gap-override descriptors let you tune the fallback to match the custom font, so the swap is visually seamless. This gives you the fastest LCP (text renders immediately in the fallback) with the least CLS (the swap does not cause reflow).
Preloading the primary font file with <link rel=”preload” as=”font” type=”font/woff2″ crossorigin> reduces the window between fallback and custom font rendering. The crossorigin attribute is required for font preloads regardless of whether the font is served from the same origin. Missing it causes the browser to ignore the preload entirely, which is a common mistake that wastes the preload tag without providing any benefit.
For sites where the LCP element is text (no hero image), font optimization is the primary LCP lever. Preload the font, use swap, match the fallback metrics, and the text appears fast with no shift. That is the fastest possible LCP configuration for a text-first page.
LCP on WordPress
WordPress LCP problems follow a consistent pattern. The server responds slowly because there is no page caching. The theme loads render-blocking CSS and JavaScript. The hero image is unoptimized. Fixing these three things, in that order, brings most WordPress sites into good LCP territory.
Server-Side Caching
Without caching, every page request triggers PHP execution and database queries to assemble the page from WordPress core, the theme, and active plugins. On a shared hosting plan, this can produce TTFB of 1 to 3 seconds. A caching plugin (WP Super Cache, W3 Total Cache, LiteSpeed Cache on OpenLiteSpeed) or server-level caching stores the assembled HTML and serves it directly to subsequent visitors. This typically reduces TTFB to under 200 milliseconds, reclaiming 1 to 2 seconds that go directly toward a better LCP.
Theme and Plugin Script Loading
Themes that load multiple stylesheets, JavaScript libraries, icon fonts, and animation frameworks in the head block rendering. Lightweight themes like Kadence and GeneratePress load minimal assets by default. Heavier themes and page builders can load 500 KB or more of CSS and JavaScript before any content appears. Auditing what loads in the head (visible in the Pingdom waterfall or the Chrome DevTools Network panel) and deferring everything non-critical is the second highest-impact fix after caching.
Hero Image Optimization
WordPress has supported WebP since version 5.8 and lazy loading since version 5.5. The common LCP mistake on WordPress is that the hero image is lazy loaded by default. Since the LCP image is above the fold, lazy loading delays its download. Adding the fetchpriority=”high” attribute and removing loading=”lazy” from the hero image tells the browser to prioritize it. WordPress 6.3 and later apply fetchpriority=”high” to the first content image automatically, but themes and page builders that use custom image implementations may not inherit this behavior.
CDN
Cloudflare’s free tier provides CDN, DNS, and SSL for WordPress sites. It caches static assets (CSS, JavaScript, images, fonts) at edge locations worldwide, so returning visitors and visitors geographically distant from the server receive cached files from a nearby edge node instead of waiting for a round trip to the origin server. For a WordPress site on US hosting with international traffic, adding Cloudflare can cut LCP by 500 milliseconds or more for overseas visitors.
LCP and Server Response Time
TTFB is the foundation of LCP. Every millisecond spent waiting for the server to respond is a millisecond subtracted from the budget available for resource loading and rendering. A server that responds in 100 milliseconds gives you 2.4 seconds for everything else. A server that responds in 1.5 seconds gives you 1 second. The math is simple but the implication is critical: server speed is not one factor among many. It is the floor that everything else stands on.
The three causes of slow TTFB are hosting infrastructure, backend processing, and missing caching. Hosting infrastructure means the server hardware itself: CPU, RAM, and disk speed. A $5/month shared hosting plan puts your site on a server with hundreds of other sites competing for the same resources. Under load, response times spike. The fix is better hosting, and the cost difference between slow shared hosting and fast managed hosting is often $15 to $30/month, which is trivially justified by the LCP improvement it produces.
Backend processing means the work the server does to assemble the page. On WordPress, this is PHP execution and MySQL queries. On a cold load with no caching, WordPress might execute 50 to 200 database queries to build a single page. Each query adds milliseconds. The fix is server-side caching, which eliminates the query overhead for all visitors after the first one by serving a stored HTML file.
Missing CDN means every visitor requests the page from the origin server regardless of their geographic location. A visitor in Tokyo requesting a page from a server in New York adds 150 to 300 milliseconds of network latency before the server even begins processing the request. A CDN eliminates this by caching static resources at edge locations worldwide and, with full-page caching, serving the entire HTML from the nearest edge.
TTFB is where you start when LCP is slow, because a slow server makes every downstream fix less effective. Compressing a hero image from 2 MB to 200 KB saves 1.5 seconds of download time, but if the server takes 2 seconds to respond, the total LCP is still 3.5 seconds. Fix the server first. The image optimization delivers its full value only when the foundation is fast. This same server response principle applies to crawl budget: a slow server means Googlebot crawls fewer pages per session, which affects how quickly new and updated content enters the index.
How LCP Affects Rankings
LCP is part of the Core Web Vitals ranking signal within Google’s page experience evaluation. The signal is a tiebreaker, not a primary factor. Content relevance and quality determine most of the ranking. When two pages are closely matched on content signals, the page with better LCP can win the higher position. This is the framing Google has been consistent about: page experience matters most in competitive results where content quality is closely matched.
The practical implication is that LCP optimization produces the most ranking benefit for pages that are already strong on content but stuck in the middle of page one or at the top of page two. For those pages, the margin between ranking sixth and ranking third can include page experience signals, and LCP is the most visible component of those signals. For pages that are not competitive on content quality, fixing LCP will not overcome the content gap.
The indirect effects of LCP on rankings are often more significant than the direct signal. A fast-loading page keeps visitors engaged. A slow-loading page loses a percentage of visitors before they ever see the content, which suppresses the engagement signals (time on page, scroll depth, clicks to other pages) that Google’s ranking systems evaluate. Strong SEO writing is wasted when the page loads too slowly for the visitor to read it.
LCP also affects crawlability through server response time. Googlebot allocates a finite crawl budget to each site, and slow server responses mean fewer pages crawled per session. For sites with large content architectures supported by internal linking, server speed directly influences how quickly Google discovers and re-evaluates content across the entire site. The connection between LCP, crawl efficiency, and content freshness in the index is one of the places where calibration, the practice of measuring and adjusting based on real data, produces compounding returns over time.
FAQ
What is Largest Contentful Paint?
Largest Contentful Paint is the Core Web Vital that measures loading speed. It times how long it takes for the largest visible content element in the viewport to render, usually a hero image, a large heading, or the main text block above the fold. Google’s threshold for good LCP is 2.5 seconds or less, measured at the 75th percentile of real user page loads.
What is a good LCP score?
Google defines good LCP as 2.5 seconds or less. Under 2 seconds is strong. Under 1.5 seconds is excellent. Between 2.5 and 4 seconds needs improvement. Above 4 seconds is poor. The score is measured at the 75th percentile, which means a quarter of your visitors may be experiencing slower loads than the reported number.
How do I improve Largest Contentful Paint?
Break LCP into its four phases and fix the phase that holds the most time. Fix server response time first with better hosting and caching. Eliminate render-blocking CSS and JavaScript. Preload the LCP image so the browser discovers it early. Optimize the image with modern formats like WebP, proper compression, and correct sizing for the display dimensions. Remove lazy loading from the above-the-fold LCP element.
How do I improve Largest Contentful Paint on WordPress?
Install server-side page caching to reduce TTFB from seconds to milliseconds. Use a lightweight theme that does not load excessive render-blocking CSS and JavaScript. Optimize the hero image in WebP format at the correct display dimensions. Remove lazy loading from the hero image and add fetchpriority=”high” so the browser prioritizes it. Add Cloudflare or another CDN to serve static assets from edge locations near the visitor.
What element does LCP measure?
LCP measures the largest content element visible in the initial viewport. Qualifying elements include images, video poster frames, elements with CSS background images, and block-level elements containing text. The browser determines which element is largest by rendered area and uses that element for the LCP measurement. Run PageSpeed Insights on any page to see exactly which element is being measured.
Does LCP affect SEO rankings?
Yes. LCP is one of the three Core Web Vitals that contribute to Google’s page experience ranking signal. The signal functions as a tiebreaker when pages are closely matched on content quality. A page with good LCP will not outrank a page with better content, but it can win the position when content quality is similar. The indirect effects through user engagement and crawl efficiency often matter more than the direct signal.
Why is my LCP slow even though my images are optimized?
If images are optimized but LCP is still slow, the bottleneck is in a different phase. Check server response time first: a slow TTFB caps LCP regardless of image optimization. Check for render-blocking CSS and JavaScript that delay the paint after the image has already downloaded. Check whether the LCP image is being discovered late because it is referenced in CSS rather than HTML, or because it is being lazy loaded. The four-phase breakdown identifies which phase holds the remaining time.
Should I preload the LCP image?
Yes, if the LCP element is an image. Preloading tells the browser to start downloading the image immediately rather than waiting to discover it in the HTML or CSS. Use a link rel=”preload” tag in the head with as=”image” and the correct href. For responsive images, use the imagesrcset and imagesizes attributes on the preload tag so the browser fetches the correct variant. Do not preload more than one or two resources, because excessive preloading causes bandwidth competition that can slow down the LCP element instead of speeding it up.