Core Web Vitals: The Metrics Google Actually Measures
AI Summary
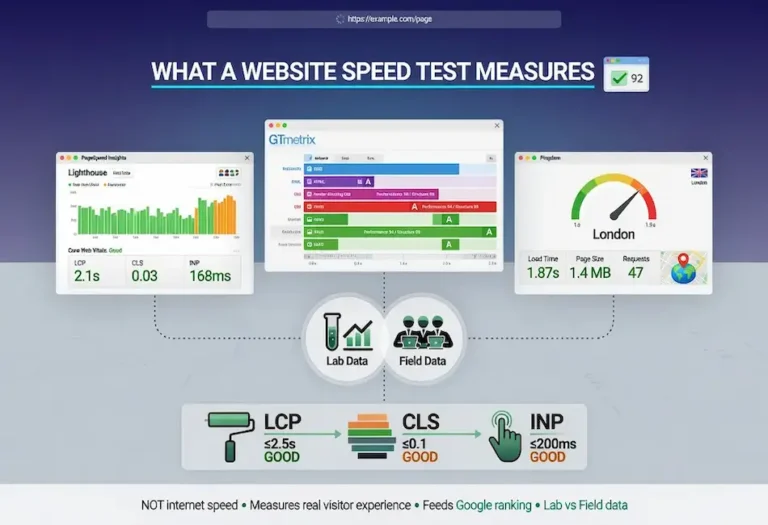
What are Core Web Vitals? Core Web Vitals are three performance metrics Google uses to measure how a page feels to the person using it. Largest Contentful Paint measures loading speed. Cumulative Layout Shift measures visual stability. Interaction to Next Paint measures responsiveness. Together they answer whether a page loads fast enough, stays still while loading, and reacts when someone taps or clicks. Google uses field data from real Chrome users to evaluate these metrics as a ranking signal.
What it is and who it is for: This guide covers what each metric measures, the thresholds that separate passing from failing, how to test your scores with the right tools, how to diagnose and fix failures, platform-specific optimization for WordPress and page builders, what “assessment failed” means in Search Console, and how these metrics actually affect rankings. It is for site owners, developers, and SEO practitioners who need to move past the scores and understand what drives them.
The rule: Core Web Vitals are a tiebreaker, not a primary ranking factor. Content relevance comes first. But when two pages match on content quality, the faster, more stable, more responsive page wins the position. The real cost of failing is not the ranking signal itself. It is losing the visitors who leave before your content has a chance to work.
What Core Web Vitals Are
Core Web Vitals are three metrics Google settled on to answer a question that used to be impossible to measure objectively: does this page feel good to use? Speed alone never captured it. A page could load its HTML in under a second and still feel broken if the text jumped around while images loaded, or if tapping a button did nothing for half a second. Google needed metrics that reflected the actual human experience of a page, not just how fast the server responded.
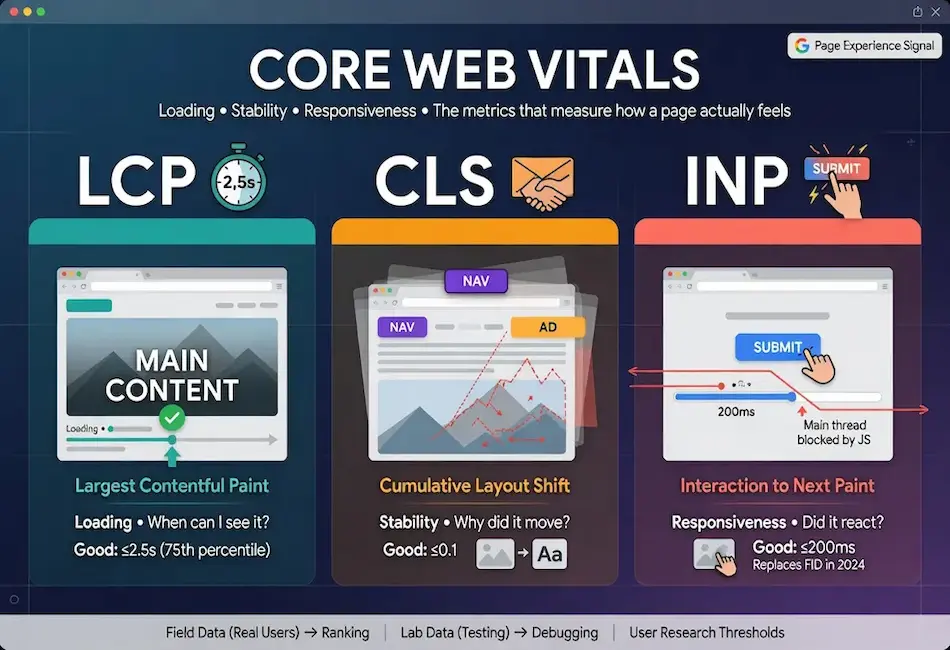
The three vitals each measure a different dimension of that experience. Largest Contentful Paint measures loading, specifically how long it takes for the largest visible element to appear. Cumulative Layout Shift measures visual stability, how much the page jumps around as it loads. Interaction to Next Paint measures responsiveness, how quickly the page reacts when a user taps or clicks. Loading, stability, responsiveness. Three questions a real visitor asks without realizing they are asking them.
What makes the vitals different from the page speed metrics that came before is that they are anchored to thresholds based on user research, not arbitrary targets. Google studied how real people perceive delays and instability and set the “good” thresholds at the point where experience degrades noticeably. Hitting those thresholds is not about impressing a testing tool. It is about staying inside the range where the page feels right to the person using it.
The vitals are part of the broader page experience signals that feed into how Google ranks search results. They sit alongside mobile usability, HTTPS, and intrusive interstitial rules. But unlike those binary signals where a page either passes or fails, Core Web Vitals operate on a sliding scale with defined thresholds that separate good from needs improvement from poor. That granularity makes them both more useful for diagnosis and more demanding to maintain over time.
Largest Contentful Paint (LCP)
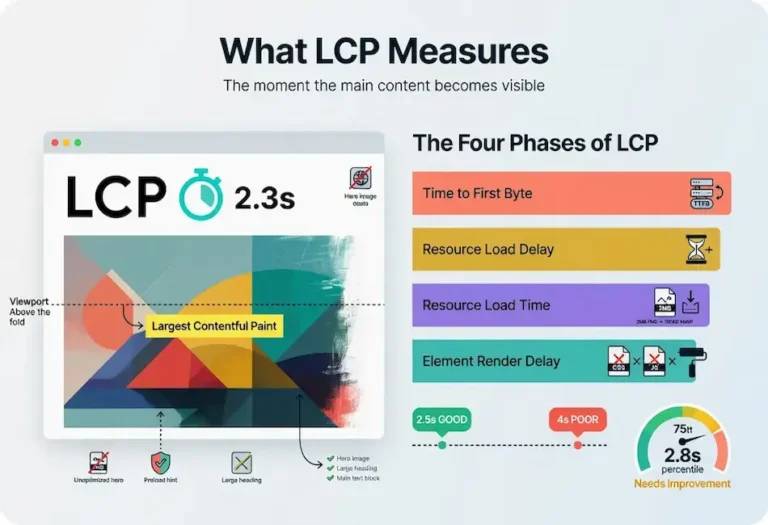
Largest Contentful Paint measures how long it takes for the largest content element in the viewport to render. On most pages that is a hero image, a large heading, or a block of text above the fold. LCP answers the visitor’s first impatient question: when can I see the thing I came here for?
Google’s threshold for good LCP is 2.5 seconds or less, measured at the 75th percentile of page loads. That last detail matters and most explanations skip it. The score is not your average load time. It is the experience of your slower visitors, the ones at the 75th percentile, which means a quarter of your traffic can be slower than your reported number. If your LCP reads 2.5 seconds, plenty of real users are waiting longer than that.
LCP problems usually trace back to a handful of causes. A slow server response that delays everything downstream. Render-blocking CSS and JavaScript that the browser has to process before it can paint. Large unoptimized images that take too long to download. Client-side rendering that makes the browser build the page from JavaScript before anything appears. The common thread is that something stands between the browser and the largest visible element, and LCP measures the total cost of that delay.
What Counts as the LCP Element
Not every element on the page is a candidate. LCP considers images (including background images set via CSS), video poster images, block-level elements containing text, and SVGs. The browser tracks which candidate is largest as the page loads, and the metric reflects the final largest element that renders within the viewport before user interaction. If the hero image takes 3 seconds but a large text block renders in 1 second and that text block is larger in area, the LCP is 1 second. Understanding which element is your actual LCP target is the first step in fixing it.
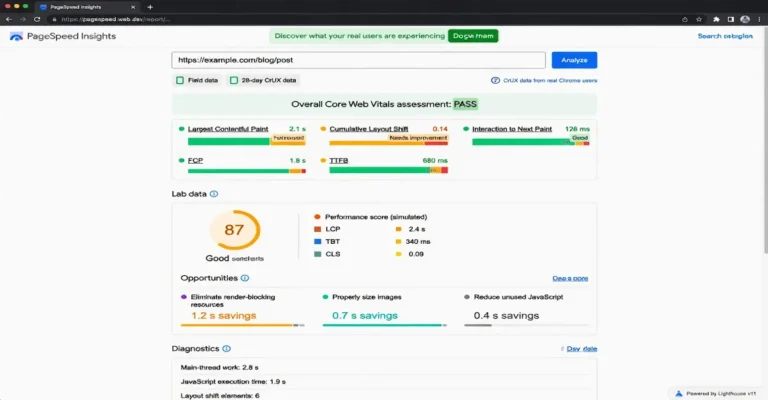
The practical move is to run PageSpeed Insights on the page and look at the “Largest Contentful Paint element” diagnostic. It tells you exactly which element is being measured, which eliminates guesswork about what to optimize.
Cumulative Layout Shift (CLS)
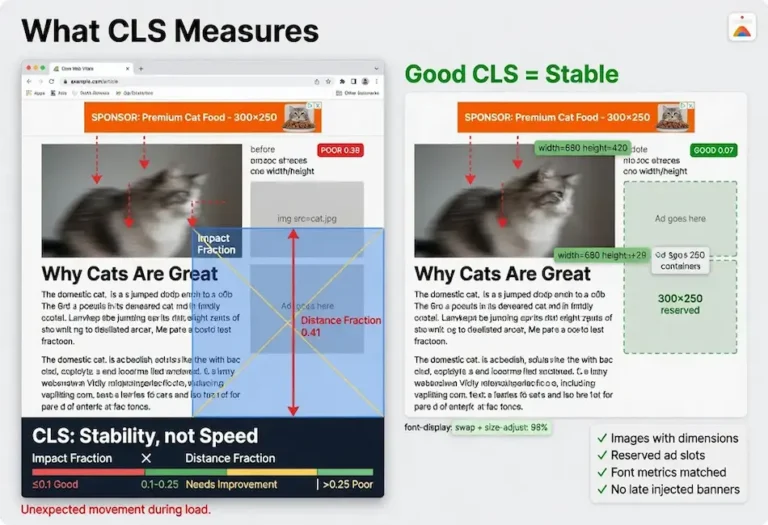
Cumulative Layout Shift measures visual stability. Specifically, it quantifies how much the visible content moves around unexpectedly while the page loads. Everyone has experienced bad CLS without knowing the name for it. You go to tap a link, an ad or image finishes loading above it, the whole page jumps, and you tap the wrong thing. That jump is layout shift, and Google measures it.
The threshold for good CLS is a score of 0.1 or less. Unlike LCP, CLS is not measured in seconds. It is a unitless score calculated from how much of the viewport shifted and how far it moved. A small element nudging slightly scores low. A large block jumping halfway down the screen scores high. The score accumulates across the whole page session, hence “cumulative,” though Google now uses a session window approach that groups shifts into windows and reports the largest window rather than the raw total.
Most layout shift comes from a few predictable sources. Images and videos without width and height attributes, so the browser does not reserve space for them before they load. Ads, embeds, and iframes that inject themselves into the layout after the page has rendered. Web fonts that cause text to reflow when the custom font swaps in. Content injected dynamically above existing content, like cookie banners or notification bars that push everything down. The fix in almost every case is reserving the space in advance so nothing has to move when the asset arrives.
CLS and Single Page Applications
CLS behaves differently on sites that load new content without full page navigation. On a traditional multi-page site, each page load resets the CLS measurement. On a single page application where navigation happens via JavaScript without a full reload, the CLS score accumulates across the entire session. A site with smooth initial loads but janky route transitions can accumulate a CLS score that fails the threshold even though no single page view was particularly bad. If you run a JavaScript-heavy application, test CLS across the full user journey, not just the initial load.
Interaction to Next Paint (INP)
Interaction to Next Paint is the newest of the three. It replaced First Input Delay in March 2024, and the change was a meaningful upgrade. First Input Delay only measured the delay before the browser began processing the first interaction. INP measures the full latency of interactions throughout the entire visit, from the moment a user taps or clicks to the moment the screen visually updates in response.
The threshold for good INP is 200 milliseconds or less. When a user taps a button, opens a menu, or expands an accordion, the page should respond within that window or the interaction starts to feel sluggish. INP captures the worst interactions across the session, so a page that responds instantly most of the time but hangs for half a second on one heavy interaction will still score poorly.
INP problems are almost always JavaScript problems. Heavy scripts that monopolize the main thread, long-running event handlers, large JavaScript bundles that the browser has to parse and execute, and third-party scripts that block interactivity. When the main thread is busy running code, it cannot respond to the user, and the interaction stalls. Reducing and deferring JavaScript is the core of fixing INP.
The Three Phases of INP
Every interaction has three phases: input delay, processing time, and presentation delay. Input delay is the gap between the user’s action and the browser starting to process it, usually caused by the main thread being occupied with other tasks. Processing time is how long the event handlers take to execute. Presentation delay is how long it takes the browser to render the visual update after the handlers finish. INP measures all three combined. Fixing INP requires identifying which phase is the bottleneck, because reducing processing time does nothing if the input delay from a competing long task is the actual problem.
Field Data vs Lab Data
This is the distinction that trips up most people, and getting it wrong leads to wasted effort. There are two kinds of Core Web Vitals measurement, and only one of them affects your rankings.
Field data, also called real user monitoring, comes from actual visitors using your page on their own devices and connections. Google collects this through the Chrome User Experience Report (CrUX), aggregating the experience of real Chrome users over a rolling 28-day window. This is the data Google uses for ranking. It reflects reality: slow phones, spotty connections, real-world conditions that no lab can replicate.
Lab data comes from a controlled test run in a simulated environment, like the test PageSpeed Insights runs on demand from a data center with a fast connection. Lab data is useful for debugging because it is repeatable and gives you immediate feedback on changes. But it does not reflect your actual users, and it is not what Google ranks on. A page can post excellent lab scores and still fail its field vitals because the lab test ran on infrastructure no real visitor has access to.
The practical implication: use lab data to diagnose and verify fixes, but judge your actual standing by field data. The tools that report these metrics show both, with field data taking priority when Google has enough real traffic to report it. If your site is new or low-traffic, CrUX may not have enough data to generate a field report. In that case, lab data is all you have to work with, and improving it is still worthwhile because the same fixes that improve lab scores will improve field scores once enough users visit.
One detail that matters for sites running on calibration cycles: field data lags by 28 days. A fix deployed today will not show in the field data for roughly a month. If you fix an LCP issue and check CrUX the next day expecting improvement, you will see the old data. This is why lab data is the verification tool for changes and field data is the confirmation that arrives later.
How to Test Core Web Vitals
Multiple tools report Core Web Vitals, and each one serves a different purpose. Using the wrong tool for the job produces either misleading data or incomplete answers. The testing workflow starts with field data for the ranking-relevant picture, then moves to lab tools for diagnosis.
Google Search Console
The Core Web Vitals report in Search Console groups your URLs into good, needs improvement, and poor based on CrUX field data. This is the highest-level view of where your site stands in Google’s evaluation. It shows which specific URLs are failing and which metric is the cause. Start here to identify the pages that need attention. The report requires enough traffic to generate CrUX data, so new sites or low-traffic pages may not appear.
PageSpeed Insights
PageSpeed Insights is the primary testing tool because it shows both field data (when available) and lab data on the same screen. The field data section at the top reports what real users experienced. The lab data section below runs a Lighthouse audit and provides specific diagnostics with estimated time savings for each fix. This is the tool that connects the ranking signal (field) with the fix list (lab).
GTmetrix and Pingdom
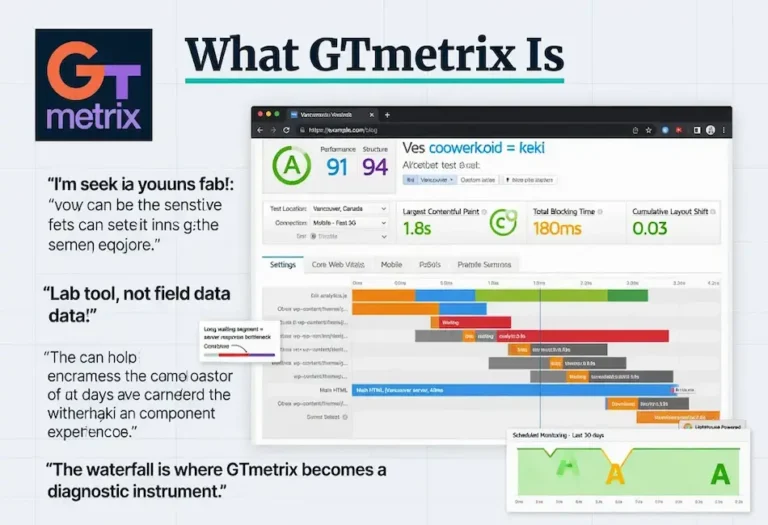
GTmetrix runs the Lighthouse engine and adds monitoring over time, which is useful for catching regressions after you deploy fixes. Pingdom does not report Core Web Vitals directly, but its waterfall chart is the cleanest diagnostic for isolating which specific resource is the bottleneck. The three tools together cover field data (PageSpeed Insights), lab diagnostics with monitoring (GTmetrix), and resource-level waterfall diagnosis (Pingdom).
Chrome DevTools and web-vitals Library
For developers who need real-time measurement during development, Chrome DevTools includes a Performance panel that reports LCP, CLS, and INP during a recorded session. The web-vitals JavaScript library (maintained by Google) can be added to any site to log Core Web Vitals data from real users to your own analytics. This is how you build your own field data pipeline independent of CrUX, and it is particularly useful for sites that need faster feedback than the 28-day CrUX window provides.
The complete testing framework, including when to use each tool and how they connect, is covered in the website speed test guide.
Core Web Vitals Assessment Failed
When Google Search Console shows “Core Web Vitals assessment: failed,” it means one or more of the three metrics fell below Google’s good threshold based on the field data from real users over the most recent 28-day window. The report tells you which metric failed and which URLs are affected.
The first thing to check is whether the failure is across the whole site or limited to specific page types. A sitewide LCP failure usually points at a hosting or server-level issue. An LCP failure on only blog posts with hero images points at image optimization. A CLS failure on pages with ads points at ad containers missing reserved dimensions. The pattern in the Search Console report narrows the diagnosis before you open any testing tool.
Common Reasons for Assessment Failure
LCP failures are the most common. The usual causes: unoptimized images (serving full-resolution files when the display size is a fraction of the source), slow server response time (cheap shared hosting under load), render-blocking CSS or JavaScript that delays the first paint, and web fonts that block text rendering until the font file downloads.
CLS failures typically come from images without explicit width and height attributes, dynamically injected content like cookie consent banners that push the page down, and late-loading ad slots that shift surrounding content when they fill.
INP failures point at JavaScript. Heavy third-party scripts, unoptimized event handlers, and main thread congestion from too much synchronous JavaScript execution. Sites running multiple analytics tags, chat widgets, and marketing scripts simultaneously are the most frequent INP failures.
When “Not Enough Data” Appears
If Search Console shows insufficient data instead of a pass or fail, the page does not have enough Chrome user visits to generate a CrUX report. This is not a failure. It means Google does not have enough field data to evaluate the page. For low-traffic pages, focus on lab testing through PageSpeed Insights and fix what the Lighthouse audit flags. The field data will populate once traffic reaches the threshold.
How to Fix and Optimize Core Web Vitals
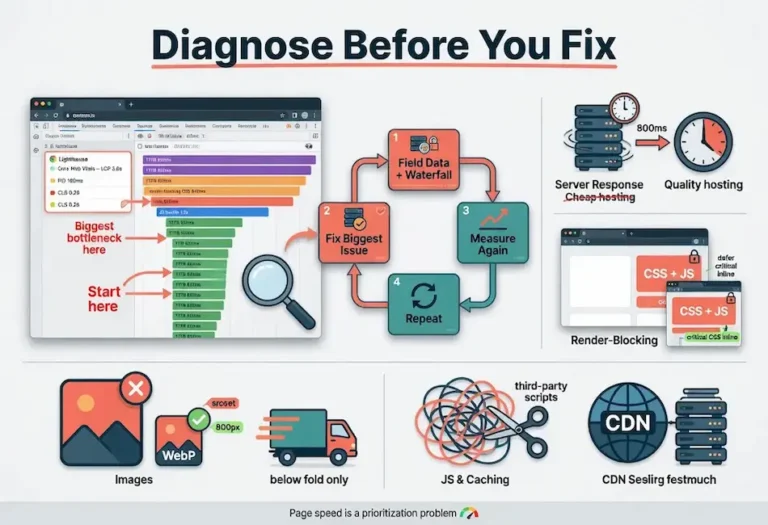
Optimization follows a priority sequence. The fixes that produce the largest improvement for the least effort come first. The detailed walkthrough lives in the page speed optimization guide, but the summary here maps each fix to the specific vital it improves.
Fixing LCP
Start with the server. If TTFB (Time to First Byte) is above 600 milliseconds, no front-end optimization will save LCP because the floor is already too high. Move to better hosting, enable server-side caching, or put a CDN in front of the origin. Once the server responds fast, address the LCP element directly. If it is an image, convert to WebP, serve the image at the correct display dimensions, and add a preload hint in the head so the browser fetches it before it encounters it in the HTML. If it is a text element, eliminate render-blocking CSS and JavaScript so the browser can paint text without waiting for external resources.
Fixing CLS
Add explicit width and height attributes to every image and video element. This is the single highest-impact CLS fix because it lets the browser reserve space before the asset downloads. For ads and embeds, wrap them in a container with a minimum height that matches the expected ad size. For web fonts, use font-display: swap with a fallback font that has similar metrics so the text does not reflow dramatically when the custom font loads. For dynamically injected content like banners, insert it below the fold or use CSS transforms instead of layout-triggering properties.
Fixing INP
Break long JavaScript tasks into smaller chunks using requestIdleCallback or setTimeout to yield to the main thread. Defer non-critical JavaScript so it does not compete with interaction handlers. Remove or lazy-load third-party scripts that are not essential to the page’s core function. Audit event handlers to ensure they are not doing expensive DOM manipulation synchronously. The goal is keeping the main thread available to respond to the user within the 200-millisecond window.
The Priority Sequence
Fix server response time first because it sets the floor for everything. Fix images second because they are the most common LCP element and the easiest to optimize. Fix CLS third because the fixes are mechanical (add dimensions, reserve space) and rarely require architectural changes. Fix INP last because JavaScript optimization is the most complex and the most likely to require developer involvement. This sequence delivers the most visible improvement in the shortest time.
Core Web Vitals and WordPress
WordPress sites have a specific set of Core Web Vitals challenges that differ from custom-built sites. The CMS itself is fast when configured properly. The problems come from what gets stacked on top of it: themes loaded with unused CSS, plugins that inject JavaScript on every page whether it is needed or not, and page builders that generate deeply nested DOM structures.
Theme Selection
The theme is the foundation. A lightweight theme like Kadence, GeneratePress, or Developer-oriented themes built on clean HTML output will pass Core Web Vitals with minimal effort. A theme with a built-in slider, animation libraries, icon font sets, and multi-purpose layout options loads hundreds of kilobytes of assets the page may never use. Choosing the right theme is the highest-leverage decision for WordPress Core Web Vitals because it determines the baseline weight before a single plugin or piece of content is added.
Plugin Discipline
Every active plugin has the potential to add CSS and JavaScript to every page load. A site with 30 active plugins is almost certainly loading scripts from 15 or more of them on pages where those scripts serve no function. The discipline is to audit which plugins load assets globally and either replace them with lighter alternatives, conditionally load their assets only on pages where they are used, or remove them entirely if their function does not justify their performance cost.
Caching and CDN
Server-side page caching eliminates the database queries that slow down WordPress TTFB. A caching plugin or server-level cache (LiteSpeed Cache on OpenLiteSpeed, or similar) serves a static HTML file instead of rebuilding the page from PHP and MySQL on every request. A CDN puts cached copies of static assets on edge servers close to the visitor. Together, caching and CDN typically cut LCP by 40% to 60% on a WordPress site that was previously uncached.
Image Handling
WordPress has supported lazy loading images natively since version 5.5 and serving WebP since version 5.8 (with supported hosting). The gaps are in the details: ensuring the LCP image is excluded from lazy loading so it loads immediately, compressing images before upload rather than relying solely on server-side optimization plugins, and setting correct dimensions in the markup so CLS stays clean. A plugin like Imagify or ShortPixel handles compression, but the dimension attributes still need to be in the HTML.
Core Web Vitals and Page Builders
Page builders create a specific tension with Core Web Vitals. They make design accessible to people who do not write code. They also generate the kind of DOM complexity and asset weight that degrades performance. The question is not whether page builders are bad. It is where the line is between using them effectively and using them in ways that cost measurable ranking and user experience.
The Container Problem
Page builders like Elementor, Divi, and WPBakery work by nesting containers inside containers inside containers. A single section in the visual editor might generate three, four, or five layers of div elements in the HTML, each with inline styles, responsive classes, and data attributes. Multiply that across 15 sections on a page and the DOM node count can reach into the thousands before the content itself is counted. A high DOM node count slows down rendering, increases CLS risk as the browser processes all those layout calculations, and drags INP because the browser has to traverse more nodes to handle interactions.
The builder that handles this best in practice is Elementor with its Container widget using the Flexbox layout, which flattens the nesting compared to the legacy section/column structure. A skilled builder who understands the performance implications can produce pages that pass Core Web Vitals on Elementor. The difference between passing and failing is not the tool. It is how deep the nesting goes and how disciplined the builder is about structure.
Shopify and Platform-Hosted Builders
Shopify handles Core Web Vitals differently because the hosting infrastructure is managed by the platform. Server response time, CDN, and SSL are handled at the platform level, which removes the hosting variable. The Core Web Vitals challenges on Shopify are almost entirely front-end: theme bloat, app scripts, and liquid template rendering. Each Shopify app installed has the potential to inject JavaScript, and stores with 15 or more apps frequently fail INP because the combined script weight overwhelms the main thread.
The Shopify-specific optimization path is theme selection (Dawn and similar lightweight themes outperform multipurpose themes by a wide margin), app auditing (remove apps whose features do not justify their script cost), and lazy loading of non-critical content below the fold.
When to Skip the Page Builder
For content-heavy sites where performance directly affects rankings, like an SEO agency site or a content publisher, a block-based theme (WordPress native blocks or Kadence Blocks) produces cleaner output than a page builder. The blocks generate semantic HTML without the nesting overhead. The visual editing experience is less flexible than Elementor or Divi, but the performance difference is measurable: fewer DOM nodes, less CSS, less JavaScript, faster LCP, better INP. The tradeoff is design flexibility for performance. Sites where crawlability and on-page SEO are primary concerns benefit from the leaner output.
How Core Web Vitals Affect Rankings
Core Web Vitals are a ranking signal, but understanding their actual weight prevents both neglect and obsession. They are part of Google’s page experience signals, and Google has been consistent that page experience is a tiebreaker, not a primary factor. Content relevance and quality come first. When two pages are closely matched on relevance, the better page experience can be the deciding factor.
What this means in practice: passing Core Web Vitals will not rocket a thin, irrelevant page to the top. But failing them can hold back a strong page that would otherwise rank well, especially in competitive results where the margins between pages are narrow. The vitals are most worth your attention when your content is already solid and you are looking for the edge that moves you from position six to position three.
There is also a conversion argument that exists independently of rankings. Pages that load fast, stay stable, and respond quickly keep users engaged. Slow, janky pages get abandoned. Even if Core Web Vitals carried zero ranking weight, the user experience they measure directly affects whether visitors stay, read, and convert. The ranking benefit is real but secondary to the simple fact that a better-performing page serves the people who land on it.
The Indirect Effects
The signals that Core Web Vitals influence extend beyond the direct page experience ranking factor. A fast page keeps more visitors engaged, which reduces bounce rate and increases time on site. Users click through to additional pages, generating the kind of engagement patterns that feed back into ranking evaluations through behavioral signals. A slow page loses visitors before they can engage with the content, suppressing the engagement signals that strong SEO writing would otherwise produce.
Speed also affects crawl budget. Google allocates a limited number of requests per crawl session to each site. Pages that respond slowly consume more of that budget per page, which means fewer total pages get crawled in each session. For a site with hundreds or thousands of pages, slow response times can mean pages deep in the architecture wait days or weeks between crawls. Fixing Core Web Vitals, particularly server response time, improves both the user-facing experience and the rate at which Google discovers and re-evaluates content.
The bottom line is practical. Fix Core Web Vitals because the user experience is worth fixing. The ranking signal is a bonus. The crawl efficiency gain is another bonus. The conversion improvement is the most immediately measurable benefit. All four move in the same direction when the vitals pass. A complete site audit includes Core Web Vitals as one component of the technical evaluation, and the fixes often overlap with other technical improvements like internal linking architecture and content structure that produce compounding returns.
FAQ
What are Core Web Vitals?
Core Web Vitals are three performance metrics Google uses to measure how a web page feels to the person using it. Largest Contentful Paint measures loading speed, Cumulative Layout Shift measures visual stability, and Interaction to Next Paint measures responsiveness. Google collects these metrics from real Chrome users and uses them as a ranking signal within the broader page experience evaluation.
What does Core Web Vitals assessment failed mean?
When Google Search Console shows “Core Web Vitals assessment: failed,” it means one or more of the three metrics fell below Google’s good threshold based on real user data from the past 28 days. The report identifies which metric failed and which URLs are affected. The fix depends on which metric is failing: LCP failures point at server speed or image optimization, CLS failures point at missing image dimensions or injected content, and INP failures point at JavaScript blocking the main thread.
How do I test Core Web Vitals?
Start with the Core Web Vitals report in Google Search Console for the field data Google uses for ranking. Run individual pages through PageSpeed Insights to see both field and lab data with specific fix recommendations. Use GTmetrix for ongoing monitoring and Pingdom for geographic load testing and waterfall diagnosis. Chrome DevTools provides real-time measurement during development.
Do Core Web Vitals affect SEO rankings?
Yes, but as a tiebreaker rather than a primary factor. Content relevance and quality determine most of the ranking. When two pages are closely matched on content signals, the page with better Core Web Vitals scores can win the higher position. Failing Core Web Vitals will not destroy rankings for a strong page, but it can hold it back from positions its content quality would otherwise earn.
How do I fix Core Web Vitals on WordPress?
Start with server-side page caching to eliminate slow database queries on every request. Choose a lightweight theme like Kadence or GeneratePress that produces clean HTML. Compress and properly size images before uploading, convert to WebP format, and ensure width and height attributes are set on every image element. Audit active plugins and remove any that load JavaScript or CSS globally without serving a function on every page. Add a CDN to serve static assets from edge servers close to the visitor.
What is a good LCP score?
Google’s threshold for good Largest Contentful Paint is 2.5 seconds or less, measured at the 75th percentile of real user page loads. Under 2 seconds is strong. Under 1.5 seconds is excellent. The score reflects how long the largest visible element in the viewport takes to render, which on most pages is a hero image or a large text block above the fold.
What is the difference between field data and lab data for Core Web Vitals?
Field data comes from real users visiting your site on their own devices and connections, collected through the Chrome User Experience Report over a rolling 28-day window. Lab data comes from a controlled test run in a simulated environment by tools like Lighthouse. Google uses field data for ranking. Lab data is useful for diagnosing problems and verifying fixes because it provides immediate, repeatable results, but it does not reflect real user conditions and is not used for ranking.
Do page builders like Elementor hurt Core Web Vitals?
Page builders can hurt Core Web Vitals when used without performance discipline. The container nesting that page builders generate creates deep DOM structures with excess CSS and JavaScript that slow rendering and drag INP scores. A skilled builder using Elementor’s Flexbox Container layout can produce pages that pass all three vitals. The problem is not the tool itself but how deep the nesting goes and how many unused assets the builder loads on pages that do not need them.